Dear All,
When RBI after market hours on 23rd July announced that the total quantum of funds available under liquidity adjustment facility (LAF)has been capped to 0.5% (lowered from 1%) of individual bank’s net deposits and time liabilities (NDTL), which would be effective from July 24, 2013, which triggered the sell-off on Wednesday Morning, particularly Bank Stocks in particular.
RBI also increased the requirement of minimum daily cash reserve ratio (CRR) maintenance to 99% from 70%, which would be effective from first day of fortnight beginning July 27, 2013.
So RBI gave a clear signal that it worried Only about Rupee depreciation and not about growth factors.
Apart from domestic Issued looming fear over slowdown in China coupled with caution ahead of Reserve Bank of India and US Federal Reserve’s policy meeting next week.
Reserve Bank of India’s monetary policy on Tuesday will be a key trigger for markets in terms of any cue on liquidity measures to support rupee.
Meanwhile US Federal Reserve will unveil its policy decision on Wednesday with investors awaiting clarity on tapering of the stimulus.
Crisil slashes GDP forecast to 5.5% on rupee weakness,Montek Singh Ahluwalia Said while Growth may dip to 5% for rest of 12th plan. Surely these messages are not good for Market.
So lets go to Technicals...
>>> Nifty - Daily <<<
>>> As given on Last Weekly Review - 22nd July, 2013
>Click the chart to see on full screen<
Above chart Published last week and said every one that Wave B ended and C should start any time. Advised caution.
>>>Happened and Yet to<<<
>Click the chart to see on full screen<
So Nifty made 6093 and started sliding for wave C, Hit a low of 5869.
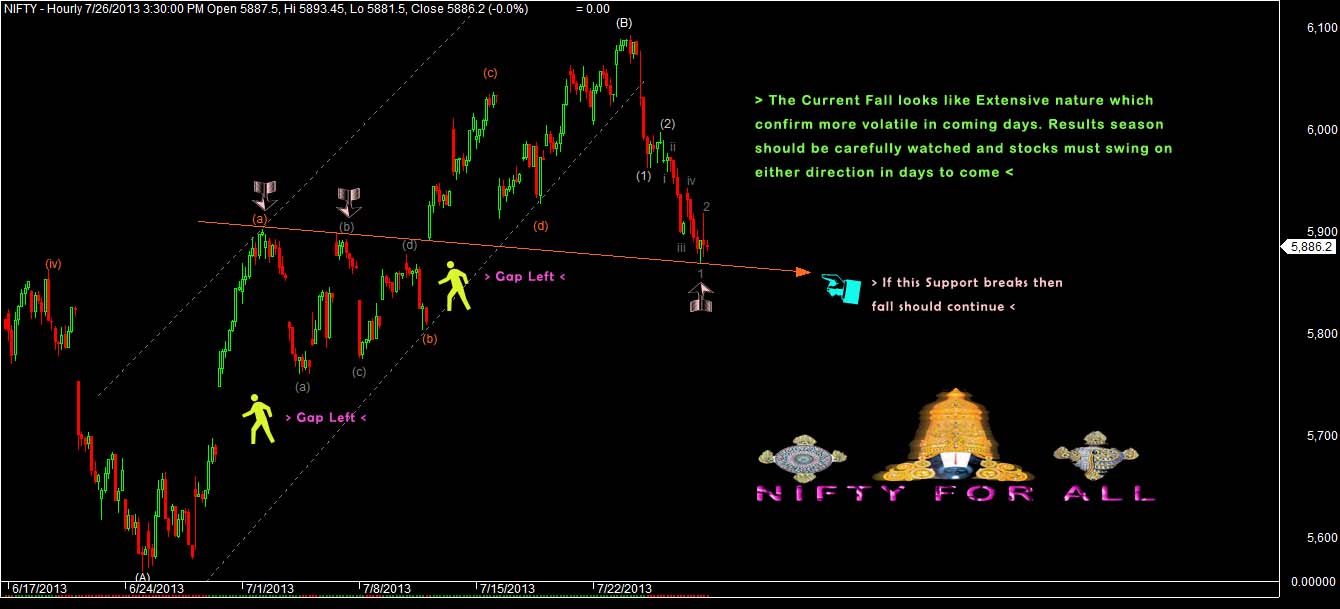
>>>> Nifty - Hourly <<<
>Click the chart to see on full screen<
Above chart is Hourly and marked with lot of extension wave signals us that heavy volatile is getting ready to hurt us. Indeed if the support line as shown on chart gets broken Price should move downward to fill the gap left.
>>> Bank Nifty <<<
>>> As given on Last Weekly Review - 22nd July, 2013 <<<
>Click the chart to see on full screen<
>>> Happened and Yet to <<<
>Click the chart to see on full screen<
Bank Nifty - Have advised caution last week and Bank stocks in particular. As expected Wednesday sell off in bank nifty and Bank stocks Hammered down heavily.
>>> Block Bluster Charts and Performance Last Week <<<
>>> Jp Associates <<<
>>> As Published on 22nd July, 2013
>Click the chart to see on full screen<
>>> Happened <<<
>Click the chart to see on full screen<
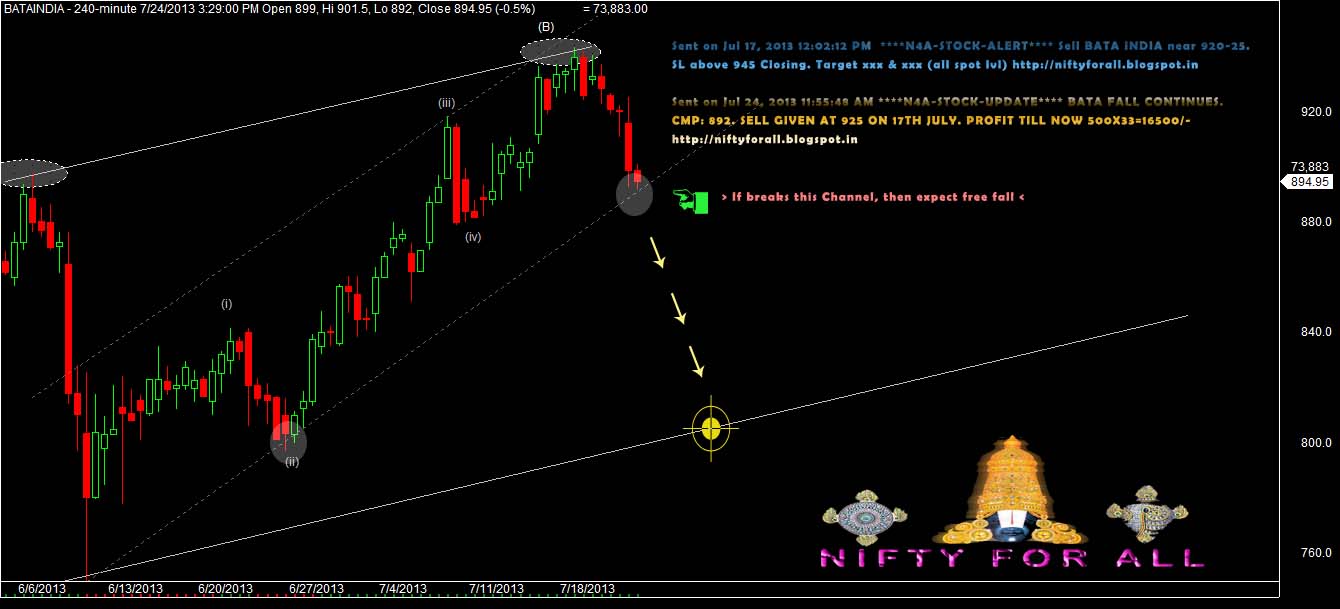
>>> Bata India <<<
>>> As Published on 23rd July, 2013 <<<
>Click the chart to see on full screen<
>>> Happened<<<
>Click the chart to see on full screen<
>>> Ambuja Cement <<<
>Click the chart to see on full screen<
>>> Tata Power <<<
>Click the chart to see on full screen<
>>> IBRealEst <<<
>Click the chart to see on full screen<
>>> Performance <<<
>Click the image to see on full screen<