Pages

Wednesday, April 29, 2015

Expiry Ahead !!!

Dear All,

>>> Nifty 15 Mins Chart <<<

>>> Click the chart to see on full screen <<<

Even after price breaks out from the channel, there is no strength still, shows more consolidation ahead. If key support 8180-90 breaks , 5th wave on the downside may start for a fall towards 8000. Else if breaks above 8362-64 may trigger a fresh upmove and short covering. Interesting day ahead on Expiry Day.


>>> DLF <<<

>>> Click the chart to see on full screen <<<

We Booked Profit @ 135 with Rs.16000. Next Target around 140. Buy on Dips for more rally. Cheers!!!

Tuesday, April 28, 2015

Copper - Just Sell & Hold. Free Fall to Start any time

Dear All,

>>> Copper Daily Chart <<<

>>> Click the chart to see on full screen <<<

Just Sell Sell Sell Copper. If unable to Cross above 399, then Free Fall to Start any time. Just Sell. Cheers!!!

Is this a - Relief Rally or Reversal Rally ????

Dear All,

>>> Nifty Hourly Chart <<<

>>> Click the chart to see on full screen <<<
Price clearly resisted at the trend line today as shown on above chart. Today's Rally topped out @ 8307 and down nearly 42 Points from the trend line. The Neck Line (2nd Straight Line) may act as a stiff resistance near 8350-60. Cross above these two lines may give strength for bulls.

>>> Nifty Hourly Chart <<<

>>> Click the chart to see on full screen <<<
RSI break out confirm the PAUSE on Bear fall. High possibilities of testing all three resistances.

>>> Bank Nifty Hourly Chart <<<

>>> Click the chart to see on full screen <<<
Looks like a double bottom. Price must cross the trend line for a healthy rally. Cheers!!!

Monday, April 27, 2015

Where is the Relief Rally ???

Dear All,

>>> Nifty Hourly Chart <<<

>>> Click the chart to see on full screen <<<

Above chart Shows how the price so far moved along with the fan. Currently the Price may get its support near 8190-8200 Level.

>>> Nifty 5 Mins Chart - Posted on Weekly Review <<<

>>> Click the chart to see on full screen <<<

On Weekly Review, Mentioned how the price travelling inside the channel to find its support at the end of sub wave (3).

>>>Nifty 5 Mins Chart - Happened and Yet to<<<

>>> Click the chart to see on full screen <<<

Price continue to fall today also. Our early morning message on Nifty Support broken till 8220. Now the Last Support @ 8180 which is 100% of the last leg of Wave (3), if breaks then may test 8130 and 8065 on the downside.

Sunday, April 26, 2015

Weekly Review - 27.04.2015

Dear All,


Please send message on whatsup only, as per the format given.

>>> Nifty Daily Chart - Bullish Alternative <<<

>>> Click the chart to see on full screen <<<

As per Bullish view, 4th wave looks almost ended or Nearing to end. Either 200 Day Moving Average or Channel Line may support the Bulls for a recovery. Bad News Like Tax Row, Land Bill, Results outcome and rainfall may suddenly change in favourable of bulls.

>>> Nifty Daily Chart - Bearish Alternative <<<

>>> Click the chart to see on full screen <<<

Bearish Alternative looks very scary. Price on a Important Juncture of 23.6% retrace or 8273, if breaks and closes below this support, Fall can be very nasty. 7826 or 7464 can be the next level for the bears. No doubt investors and traders going to loose their confidence and stocks may see a bloody hell on bears fight on Blood.

>>> Nifty 5 Mins Chart <<<

>>> Click the chart to see on full screen <<<

Earlier Resistance 8504 helped bear to take blood out of nifty. If the above counts are not wrong, then Price nearing to end sub wave 3 for a relief rally for sub wave 4.

>>> Bank Nifty Daily Chart <<<

>>> Click the chart to see on full screen <<<

17720 or 17765 - Bank Nifty almost done its 50% correction, If this support breaks then price to touch the next level 17043.

>>> Bank Nifty Hourly Chart <<<

>>> Click the chart to see on full screen <<<

If the Support on Price and RSI holds as shown above, Expect a Relief rally.

>>> Performance till 24th April, 2015 <<<

>>> Click the image to see on full screen <<<

Send your email to niftyforall@yahoo.com for details of service.

Thursday, April 23, 2015

Do You Think Only Bearish !!! Any Other Alternative ???

Dear All,


>>> Nifty Hourly Chart - An Alternative for Bullish Scenario <<<

>>> Click the chart to see on full screen <<<

Above chart is a Bullish Scenario as an alternative. Hence the price must hold inside the triangle and must give a break out above the channel for an bullish upmove. We are neither long or short and we remain neutral, untill we get confirmation on either side.

>>> Tata Steel - Posted on 09th Apr, 2015 <<<

>>> Click the chart to see on full screen <<<

Wrote on 09th Apr, 2015, To buy Tata Steel. See what happened.

>>> Tata Steel - Happened <<<

>>> Click the chart to see on full screen <<<

We have booked here with a profit of Rs.17500/-. Break above the channel as shown on above chart, may have some more rally too.

Wednesday, April 22, 2015

Is this a Relief Rally ??? Means More Fall Ahead !!!... Caution!!!

Dear All,

>>> Nifty Hourly Chart - Posted Yesterday <<<

>>> Click the chart to see on full screen <<<

Yesterday wrote RSI on a Break out mode, So expect a Recovery...!!! But what happened is ..?!?!?!? .. Lets See in detail..

>>> Nifty Hourly - Happened and Yet to <<<

>>> Click the chart to see on full screen <<<

Moving Averages confirmed the Bearishness, RSI still on the break out mode. Later part of the day saw a good rally, shows relief rally on its way. So how far its going to be ???. Lets see more details on 5 mins charts attached below.

>>> Nifty 5 Mins Chart <<<

>>> Click the chart to see on full screen <<<

We gave Long - Send on WhatsApp Clients also. But Stop loss met - Approx 50 points Loss. Late in the afternoon, Price made a fast recovery. The reason - because of an Irregular A-B-C correction. If the Resistance given on chart - unable to cross may enable the bear to resume its selling once again. Caution advised.

Tuesday, April 21, 2015

Is this a Trend Reversal. Will 8390 Hold for tomorrow ???

Dear All

>>> Nifty Daily Chart <<<

>>> Click the chart to see on full screen <<<

Last Support from the channel, If breaks then Nifty to turn bearish and fall to continue.

>>> Nifty Hourly Chart <<<

>>> Click the chart to see on full screen <<<

Yes, it looks like 8390 may give a good support. RSI getting support and reversing, Price if able to hold above 8390, we can see a trend reversal tomorrow any time. Lets wait for it.

>>> Bank Nifty Daily <<<

>>> Click the chart to see on full screen <<<

A Bullish Dragon Fly doji on the Trend line - may be a trend reversal. Lets see it more on the hourly chart also.

>>> Bank Nifty Hourly <<<

>>> Click the chart to see on full screen <<<

18000 or 78.6% golden ration Holding still. Lets wait for more confirmation

Monday, April 20, 2015

Below Trend Line & 8490. Next Support @ 8390

Dear All,

>>> Nifty Hourly Chart <<<

>>> Click the chart to see on full screen <<<

All Important supports are getting broken, shows the strength of bear. Final Support @ 8390. Lets see.

>>> Bank Nifty Hourly <<<

>>> Click the chart to see on full screen <<<

Lets wait and See how 18000 able to hold Bank Nifty.

>>> MCLEODRUSS <<<

>>> Click the chart to see on full screen <<<

We are short in the stock from 260 onwards, today breaks below 250 and hence we are in a unbooked profit of Rs.10,000/-. As shown on above chart, its an complicated abc-x-abc corrective upmove, Completed and started falling now. Hoping for more such fall. Cheers!!!

Saturday, April 18, 2015

Weekly Review - 20.04.2015

Dear All,

Nifty ended at its lowest levels in the past two weeks as selling pressure extended for the third straight session. The Nifty finally closed at the day's low at 8606, down 100.70 points or 1.16 per cent on Friday.

Equity markets remained under pressure for the third consecutive session, and analysts across Dalal Street advice caution going into next week as benchmark indices could slip further from the current levels.

"The market is clearly weakening and you will have several more days of such sharp falls next week," says Ashwani Gujral, Fund Manager. Midcaps, which are yet to show sharp decline, may well come under the hammer, he adds.

"Every time there is some saving grace, but this time everything seems to be weakening together and that should lead to a fairly strong correction. So if you cannot take short positions, do not enter and move to the sidelines," he adds.

Gujral further cautions that investors should not go and buy on the dips because this time the dip could be hard. This could be because the way the market is reacting, chances are Monday morning on the back of good results you may have a 50 point gap up and then the sell off starts.

Meanwhile S&P dropped 1.1% on Friday, its biggest decline since March 25. Equities lost ground after industrials Honeywell International and General Electric took hits from the strong dollar, while concerns over new trading regulations in China and Greece's place in the euro zone dented sentiment.

>>> Nifty Daily - Posted on Last Weekly Review <<<

>>> Click the chart to see on full screen <<<

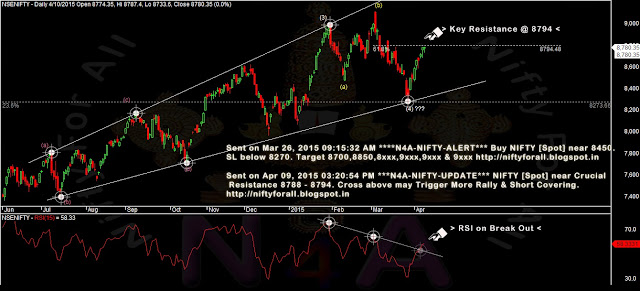
Last Week it was a clear sign of break out from RSI, as Price at the edge of an important resistance 8794.

>>> Nifty Daily - Happened & Yet to <<<

>>> Click the chart to see on full screen <<<

Crossed 8794, but unable to hold aboe it. Price and RSI are reversing after a break out. Almost a 250 Points correction from the high of 8844.

>>> Nifty Hourly <<<

>>> Click the chart to see on full screen <<<

Its a clear picture - How Price was traveling so far with break out. But the current break out - losing its control after a 250 point correction. Lets wait for more confirmation to move ahead.

>>> Nifty Hourly Chart <<<

>>> Click the chart to see on full screen <<<

8557 and 8489 may support the bulls. Channel support also looks important at current juncture. Need confirmation on either side to move ahead.

>>> Bank Nifty Daily - Posted Last Weekly Review <<<

>>> Click the chart to see on full screen <<<

Last weekly review - Bank Nifty Daily chart - got a clear support from the channel and bounced back.

>>> Bank Nifty Daily - happened and Yet to <<<

>>> Click the chart to see on full screen <<<

Clearly resisted from the Head and Shoulder Neck line, Hence the sell of was so heavy and pushed down alomost 700 Points. We Have Booked out Long near 19000 with 1000 Point Profit. So now again the channel or the middle levels support should rescue the Bulls once again. Lets see it more clear on Hourly chart.

>>> Bank Nifty Hourly Chart <<<

>>> Click the chart to see on full screen <<<

So its clear why Bank Nifty had this much sell off last week, Lets also see whats the options left for bulls to recover.

>>> Bank Nifty Hourly Chart <<<

>>> Click the chart to see on full screen <<<

So above hourly chart, suggest Cross over still not yet turned negative. So, if price able to hold the supports given on chart, possibly may give a reversal. On the other side, if the bottom gets breaks, then fall to continue.

>>> ALBK - Posted on 08th Apr, 2015<<<

>>> Click the chart to see on full screen <<<

Wrote on 08th April to buy ALBK. See what happened.

>>> ALBK - Happened <<<

>>> Click the chart to see on full screen <<<

Booked Profit @ 109. Profit Rs.20,000.

>>> DRREDDY <<<

>>> Click the chart to see on full screen <<<

Stock still falling. We have done Profit @ first Target 3660 with Rs.15000/-.

>>> Tata Steel - Posted on 09th Apr, 2015 <<<

>>> Click the chart to see on full screen <<<

It was a clear break out from the falling wedge, said to buy on 09th April. See what happened.

>>> Tata Steel - Happened <<<

>>> Click the chart to see on full screen <<<

comfortably closed above 50dma, get ready for a fast upmove. Buy on every dips.

>>> Performance till 18th Apr, 2015 <<<

>>> Click the chart to see on full screen <<<

Send email to niftyforall@yahoo.com for our service details.

>>> We are on WhatsApp also <<<

>>> Click the chart to see on full screen <<<

Thursday, April 16, 2015

Support @ 8642, 8625 & 8587

Dear All,

>>> Nifty Hourly Chart <<<

>>> Click the chart to see on full sc reen <<<

8642 if holds, may see an good bounce. 8625 and 8557 may act as a support, if breaks then fall to continue.

>>> Bank Nifty Hourly Chart <<<

>>> Click the chart to see on full screen <<<

18535 if holds, then recovery possible.

>>> DRREDDY <<<

>>> Click the chart to see on full screen <<<

Booked Profit Rs.15000/-

Wednesday, April 15, 2015

Resisted @ 8848. Key Support @ 8612 & 8586

Dear All,

>>> Nifty Hourly Chart <<<

>>> click the chart to see on full screen <<<

AFter Crossing 8794 and a RSI break out - Nifty today resisted @ 8844-48. 50 Hour Moving average gave a support @ 8720. Next Support @ 8612 or 8586.

>>> Bank Nifty Hourly <<<

>>> click the chart to see on full screen <<<

We booked 1000 Points or Rs.25000/- Profit today. We are long since 18000 and Booked @ 19000.

>>> ALBK - Posted on 08th April, 2015 <<<

>>> click the chart to see on full screen <<<

Advised to take long on ALBK. See what happened.

>>> ALBK - Happened <<<

>>> click the chart to see on full screen <<<

Booked near 109 or Rs.20,000/- Profit.