>>> Nifty Daily Chart <<<
>>> Click the chart to see on full screen <<<
Price below 50 and 100 DMA - Broken the Triangle like pattern also. Late recovery on friday gave a Long legger doji - which suggest some more rise possibe as a relief rally next week - which shall be used for a sell again.
>>> Nifty Hourly Chart <<<
>>> Click the chart to see on full screen <<<
Don't know - if the above chart is understandable or not. But i have tried to give my best counts and channels - to show how the price moved on hourly chart so far.
I feel like its a double shouldered - Head and Shoulder Pattern. Hence there shall be some possible relief rally - may fall later on. So caution again.
>>> Bank Nifty Daily Chart <<<
>>> Click the chart to see on full screen <<<
No doubt many might have wrongly guided by the last week upmove on Bank Nifty - But I have been continuously updating in our blog to stay caution - many times. Many might have trapped in Long - by the false rally - and misguided with false Rate cut news also.
Bank Nifty making a complicated move - So next movement shall be confirmed only with next week movement. Above chart say - a bounce back possible if the channel holds next week. Else it may be an one more Sell on Rise Strategy only.
>>> Bank Nifty Hourly Chart <<<
>>> Click the chart to see on full screen <<<
As usual - its very clear from hourly chart - How bulls and bears played it from the support and resistance line. Every time bulls took chance to bounce from the support line and bears take their full chance to sell when it get resisted on channels - So as per channel support on friday - seems like a relief rally possible to fill the gap left above.
>>> Weekly Stocks Performance <<<
>>> CIPLA <<<
>>> Click the chart to see on full screen <<<
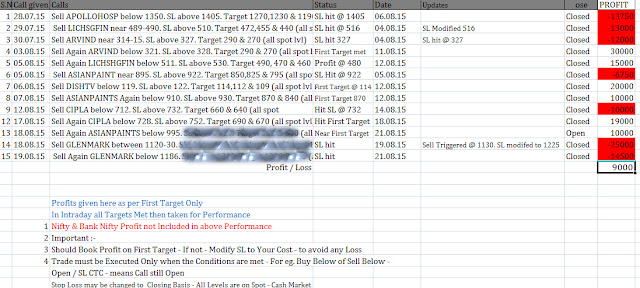
Booked Rs.19000/-
>>> ASIANPAINTS - Posted on 20th Aug, 2015 <<<
>>> Click the chart to see on full screen <<<
We have posted ASIANPAINTS as a Sell stock - See what happened.
>>> ASIANPAINTS - Happened <<<
>>> Click the chart to see on full screen <<<
Price made a low of 864 and bounced. If the throw back as shown on chart - got resisted on the channel line, price may resume the fall again.
>>> GLENMARK - Flop of the week <<<
>>> Click the chart to see on full screen <<<
Booked a Loss of 40K.
>>> Performance till 21st Aug, 2015 <<<
>>> Click the chart to see on full screen <<<
Please send email to niftyforall@yahoo.com for our service details.


