Dear All,
>>> Nifty Weekly Chart <<<
>>> Click the chart to see on full screen <<<
9920 Important on weekly basis. Close below may open door for 9530.
>>> Nifty Daily Chart <<<
>>> Click the chart to see on full screen <<<
Possible for 9750 if breaks and trades below 9920-9935.
>>> Nifty Hourly Chart <<<
>>> Click the chart to see on full screen <<<
9960 & 9920 with Channel may support.
>>> Bank Nifty Daily Chart <<<
>>> Click the chart to see on full screen <<<
23600 Support.
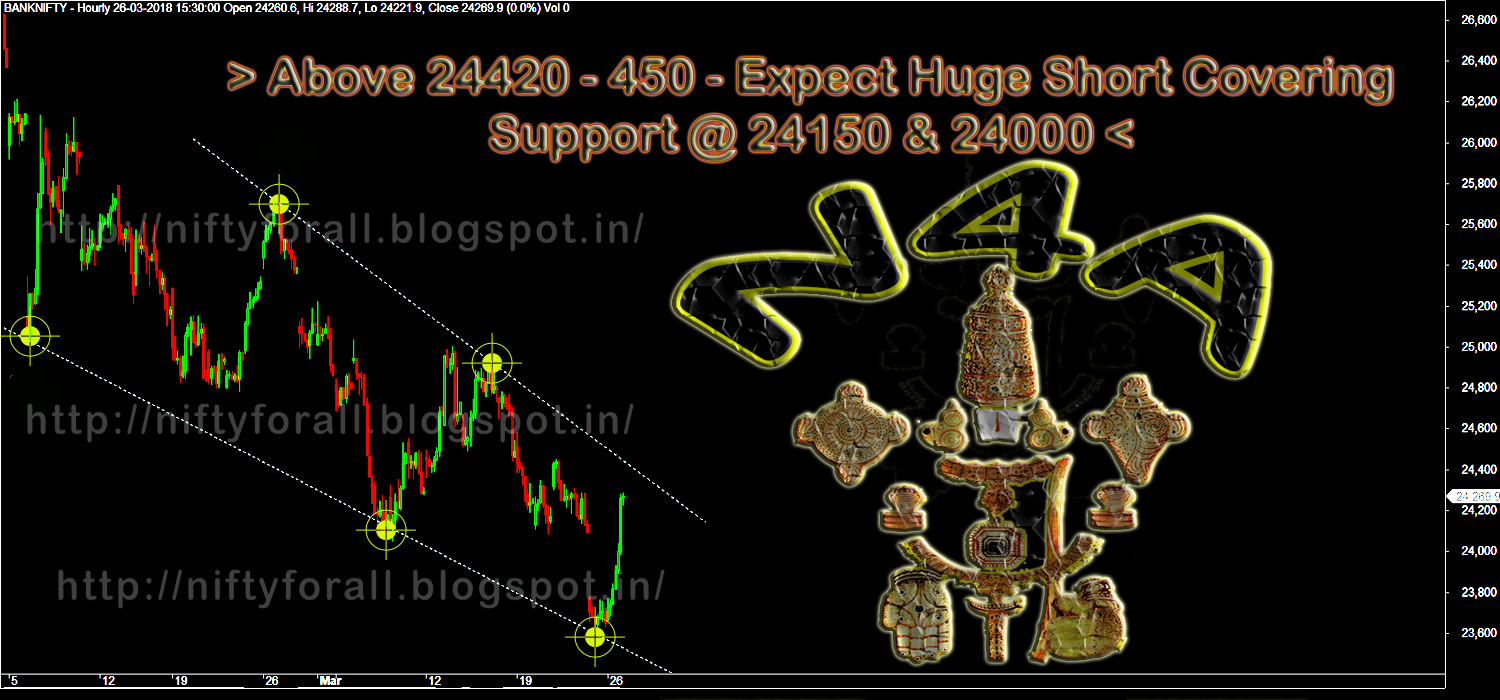
>>> Bank Nifty Hourly Chart <<<
>>> Click the chart to see on full screen <<<
Below 23600 - further downside upto 23340-23300 Possible.
>>> AshokLeyland - Hourly Chart - Posted on 22nd March 2018 <<<
>>> Click the chart to see on full screen <<<
Posted on 22nd, mentioned we have bot some PUT options.
>>> AshokLeyland - Hourly Chart - Booked Profit Rs.14000/- <<<
>>> Click the chart to see on full screen <<<
Booked Profit and No Position now.
>>> Performance till 22nd March 2018 <<<
Above performance is not a Promise or guarantee for the given Profits or Loss.Performance given based on 1 lot at a time and clients Profit differ as per the margin availability and Number of Lots taken by them. We may or may not re-enter the Calls given here hit Stop Loss, as per market movement. The charts given above are just for educational purpose only and we don't recommend any Entry / Buy or Exit / Sell. Reader must taken their own decision or consult their qualified Analyst before making any decision
>>> N4A & Whatsapp <<<