Key benchmark indices suffered huge losses, mirroring a sharp decline in the global equities as participants remained jittery on worries of a global economic slowdown. Volatility in crude oil prices and weakness in corporate earnings continued to haunt investors, resulting in persistent capital outflows.
In the week ended February 12, markets recorded the biggest weekly percentage drop since July 2009. The S&P BSE Sensex tanked 1,631 points, or 6.6 per cent, to settle below 23,000, at 22,986.12 and the broader Nifty plunged 508 points, or 6.7 per cent, to settle below 7,000, at 6,981.
Overall weakness in corporate earnings, correction in crude oil prices, liquidity crunch, government paralysis, inability to pass any major reforms such as Goods and Services Tax (GST), a tough stance by the Reserve bank of India, especially at a time when the world economies are looking at negative interest rates, rising non-performing assets (NPAs) are some of the other major reasons to add to the misery of markets
Federal Reserve chairwoman in a testimony to Congress stated that a global economic turmoil and massive sell-off in global equity markets could spook the US economy. Back home, India’s gross domestic product (GDP) expanded at a slower pace of 7.3 per cent in the December quarter of the current financial year, compared to a 7.7 per cent growth recorded in the September quarter. However, the GDP growth projection for the current financial year has been revised to 7.6 per cent. But amid the massive sell-off in global equities, investors ignored the growth estimates.
On Monday, markets are likely to react to the Consumer Price Inflation for January and Industrial Production data for December released on Friday. Index of Industrial Production (IIP) contracted an annual 1.3 per cent in December. Meanwhile, annual consumer price inflation edged up to a 17-month high of 5.69 per cent in January, driven up by higher food costs, according to a government data showed on Friday. Data on inflation based on the Wholesale Price Index (WPI) for January is due to be released by the government on Monday.
>>> Nifty Daily Chart <<<
>>> Click the chart to see on full screen <<<
Friday trade - gave a Red Color Hanging man. Need to wait and Watch.
>>> Nifty Hourly Chart <<<
>>> Click the chart to see on full screen <<<
Earlier - We have exited our Long below 7180 and re-entered long near 6870. Looking for some more rally.
>>> Bank Nifty Daily Chart <<<
>>> Click the chart to see on full screen <<<
Entire market changed when bank nifty breaks below 14740-80. Now next Support around 13300.
>>> Bank Nifty Hourly Chart <<<
>>> Click the chart to see on full screen <<<
14180 & 14400 acts as a resistance, as we may see some relief rally on bank nifty also.
>>> AXISBANK - HOURLY - FOLLOW UP <<<
>>> Click the chart to see on full screen <<<
Booked Axis Bank Profit two times and re-entered again. Hope will rally again.
>>> ADANIPORT - Hourly Chart <<<
>>> Click the chart to see on full screen <<<
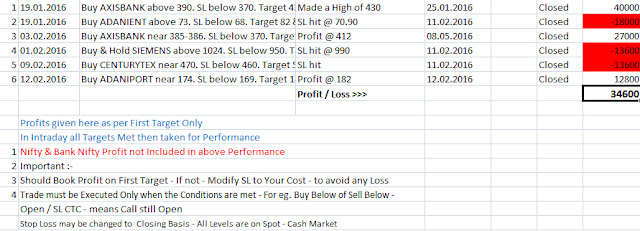
We have booked a Profit of Rs.12800 on Friday and re-entered again. Lets See.
>>> Performance till 12th Feb, 2016 <<<
>>> Click the image to see on full screen <<<
Kindly send your queries about services to niftyforall@yahoo.com or whatsapp @ 9677924975


