
It has been a choppy ride for the Indian equity markets that had been hit by the double whammy of demonetisation and the surprise victory of Donald Trump in the US Presidential elections, exactly a month ago on November 8. India’s Nifty (down 3.5%) was the second worst performing index in Asia after Philippines, and the fourth globally – after Mexico (down 5.9%), Brazil (4.3%) and Philippines (down 3.9%).
Markets will now depend on US Fed rate action, Union Budget 2017, growth in corporate earnings, progress made as regards the goods and services tax (GST) bill. Though the market has priced in a 25 basis point rate hike by the US Federal Reserve in December 2016, it is not prepared for an aggressive guidance for CY 2017.
>>> Nifty Weekly Chart - Posted Last Week <<<

>>> click the chart to see on full screen <<<
Wrote last week - Price made a double confirmation on candle sticks side. Lets see what happened this week.
>>> Nifty Weekly Chart - Happened <<<

>>> click the chart to see on full screen <<<
Price made a strong close than previous candle high and confirmed the Bulls Strength. Close above 50 & 100 WMA also give more strength.
>>> Nifty Daily Chart <<<

>>> click the chart to see on full screen <<<
Price constantly moving above 200 DMA - may test 8340,8390 and 8420 next week.
>>> Nifty Hourly Chart <<<
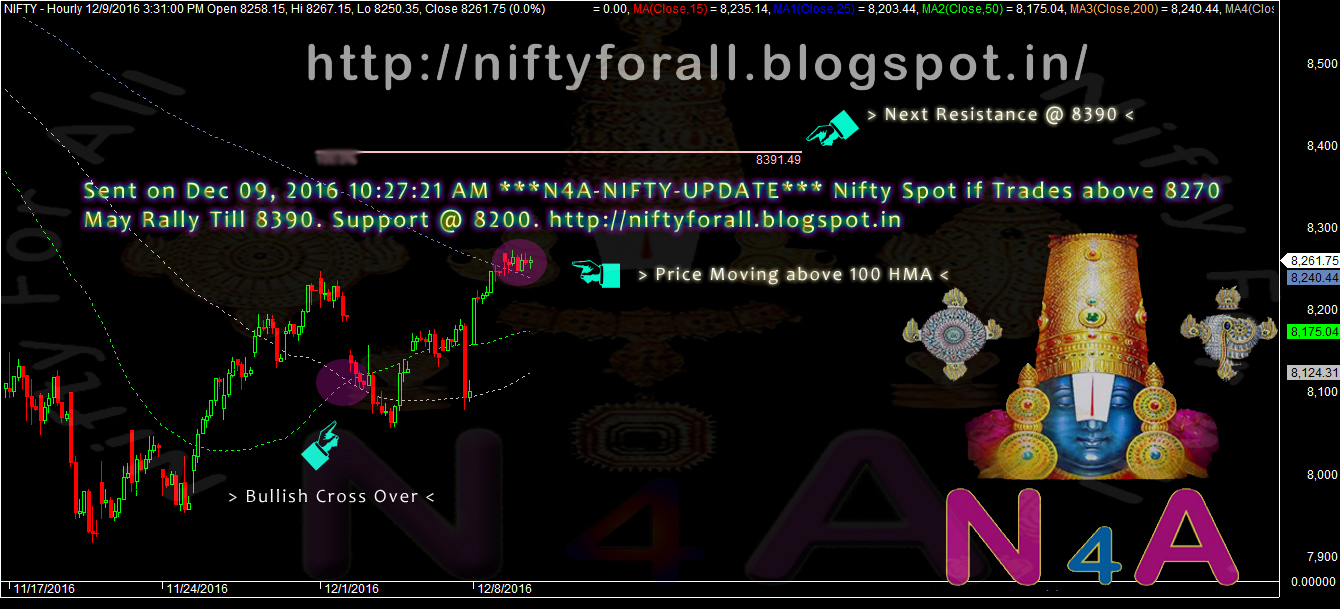
>>> click the chart to see on full screen <<<
Price moving above 200 HMA, may possibly test 8390 or above.
>>> Bank Nifty Weekly - Posted Last Weekly Review <<<

>>> click the chart to see on full screen <<<
Price made a Bullish hammer last week - See what happened.
>>> Bank Nifty Weekly Chart - Happened <<<

>>> click the chart to see on full screen <<<
Price almost test 61.8% for Wave (x) or (4) as shown above. A Bullish candle shows more rally possible.
>>> BankNifty Daily = Posted Last Weekly Review <<<

>>> click the chart to see on full screen <<<
Bank Nifty almost inside the channel - Wrote last week - Price may take support @ the channel or may test 17750 on worst case. See what happened.
>>> Bank Nifty Daily Happened <<<

>>> click the chart to see on full screen <<<
Price started moving above the channel shows some strength, may continue its rally next week also.
>>> Bank Nifty Hourly <<<

>>> click the chart to see on full screen <<<
Bank Nifty Hourly - If able to cross above 18750 - More Fire Works Possible.
>>> CNX-IT Posted on 08th Dec, 2016 <<<

>>> click the chart to see on full screen <<<
Wrote on 08th Dec, We have entered long and expecting price to move up. See what happened.
>>> CNX-IT - Booked Profit Rs.10,000/- <<<

>>> click the chart to see on full screen <<<
Booked Rs.10,000/- Profit - Price gave a break out as shown on above chart - More rally possible.
>>> SBIN - Hourly Chart - Posted on 30th Nov, 2016 <<<

>>> click the chart to see on full screen <<<
Posted on 30th Nov, about possible rally on SBI. See what happened.
>>> SBIN - Booked Profit Rs.30,000/- <<<

>>> click the chart to see on full screen <<<
Profit booked @ 265 with Rs.30,000/- Profit.
>>> Performance till 09th Dec, 2016 <<<

Above performance is not a Promise or guarantee for the given Profits or Loss.Performance given based on 1 lot at a time and clients Profit differ as per the margin availability and Number of Lots taken by them. We may or may not re-enter the Calls given here hit Stop Loss, as per market movement. The charts given above are just for educational purpose only and we don't recommend any Entry / Buy or Exit / Sell. Reader must taken their own decision or consult their qualified Analyst before making any decision

Send your Service queries to niftyforall@yahoo.com or whatsapp @ 9677924975