Dear All,
President-elect Donald Trump will officially take office on January 20, with an inauguration ceremony scheduled Friday at the US Capitol Building in Washington, DC.
Trump's tenure as US President will be marked by uncertainties involving disruptive policymaking in order to protect jobs for US natives. He is likely to formulate the policies to retain manufacturing jobs in the US.
He has promised to lower corporate tax rates to preserve factory jobs inside the United States, while threatening harsh penalties for companies that produce goods overseas to save on labour costs.
Here's is Trump presidency's likely impact on Indian industries:
IT & Pharma:-
We feel IT and Pharma would be affected adversely due to his protectionist policies.
Speaking of IT & IT-enabled services, Donald Trump's central theme has been to tighten the immigration laws to push for companies to invest and hire more in the US.
A recent re-introduction of bill to prevent companies from hiring H-1B visas is testimony of the changing times. The fear of a stringent immigration policy under Trump is not completely ruled out.
This is evident from his recent appointments who are known to be strong advocates for tighter immigration laws. However, the silver lining is, if the US economy grows through corporate tax cuts or other strategies and the employment grows quickly, there will be demand for IT & back offices services, thus increasing the opportunities as well.
Pharma industry may also be partly affected. Trump has highlighted high prices of drugs and manufacturing overseas as a concern for his administration and warned that he would create fresh bidding procedure for government programs.
However, we don't anticipate larger impact given the share of Indian drug manufactures in value terms.
Metals:-
We anticipate increase in prices of industrial metals in the backdrop of rising infrastructure spends in US which is expected to the tune of USD 1 trillion. This will lead to inflationary pressures in India.
Crude Oil:-
We expect positive developments as Trump may dilute the regulations for the US fracking industry, thus reducing the average cost of production for shale gas.
This will encourage more shale gas production from US firms which would keep the crude oil prices in check despite production cuts from OPEC & Non-OPEC countries.
Fund outflows:-
Now talking of global fund flows to India, we have already seen an exodus of funds from emerging markets including India to US. This includes flows both from debt and equity markets due rising yields as a result of fiscal expansion and monetary tightening policies.
Global concerns:-
On the global concerns not affecting India per se, The President elect has plans to renegotiate or re-evaluate all the foreign trade policies say North American Free trade Agreement (NAFTA) or Trans Pacific Partnership (TPP).
New trade agreements will be negotiated that provide for the interests of US workers and companies first. This would negatively impact countries like Mexico, Canada, China etc.
Important events of the week:-
Tata Group companies, especially TCS, hogged attention after Chandrasekaran’s promotion to Tata Sons’ top post. Experts believe rocking the management boat at this juncture is not prudent as the sector is already facing multiple headwinds.
On the macro front, consumer Price Index-based inflation fell to 3.4% in December versus 3.6% in the previous month, while industrial production belied all expectations of huge adverse impact of demonetisation by rising 13-month high of 5.7% in November against a contraction of 1.8% in the previous month. However, the sharp rise resulted due to lower base effect of November 2015 and a sharp reversal of a 12-month declining trend in capital goods.
Globally, Trump, in his presser, refrained from dropping any clarity on future economic policies, but spoke about scrapping Obamacare, calling for cheaper drugs and pledging higher job opportunities in United States.
MARKET NEXT WEEK:-
The market will await wholesale price index-based inflation data due on Monday, along with key corporate results such as Reliance Industries, HPCL, LIC Housing Finance, Axis Bank, YES Bank and Delta Corp. Global markets will remain under radar as Trump will assume office on January 20. Investors will also react to China’s gloomy exports data, which fell 7.7% in 2016.European Central Bank’s policy meeting on Thursday and back home Goods and Services Tax (GST) Council meeting on Tuesday will also be under focus.
>>> Nifty Hourly Chart <<<
>>> Click the chart to see on full screen <<<
Daily Candle tested 61.8% and 100 DMA, drifted and formed a Bearish Hanging man. Must wait and watch next week move.
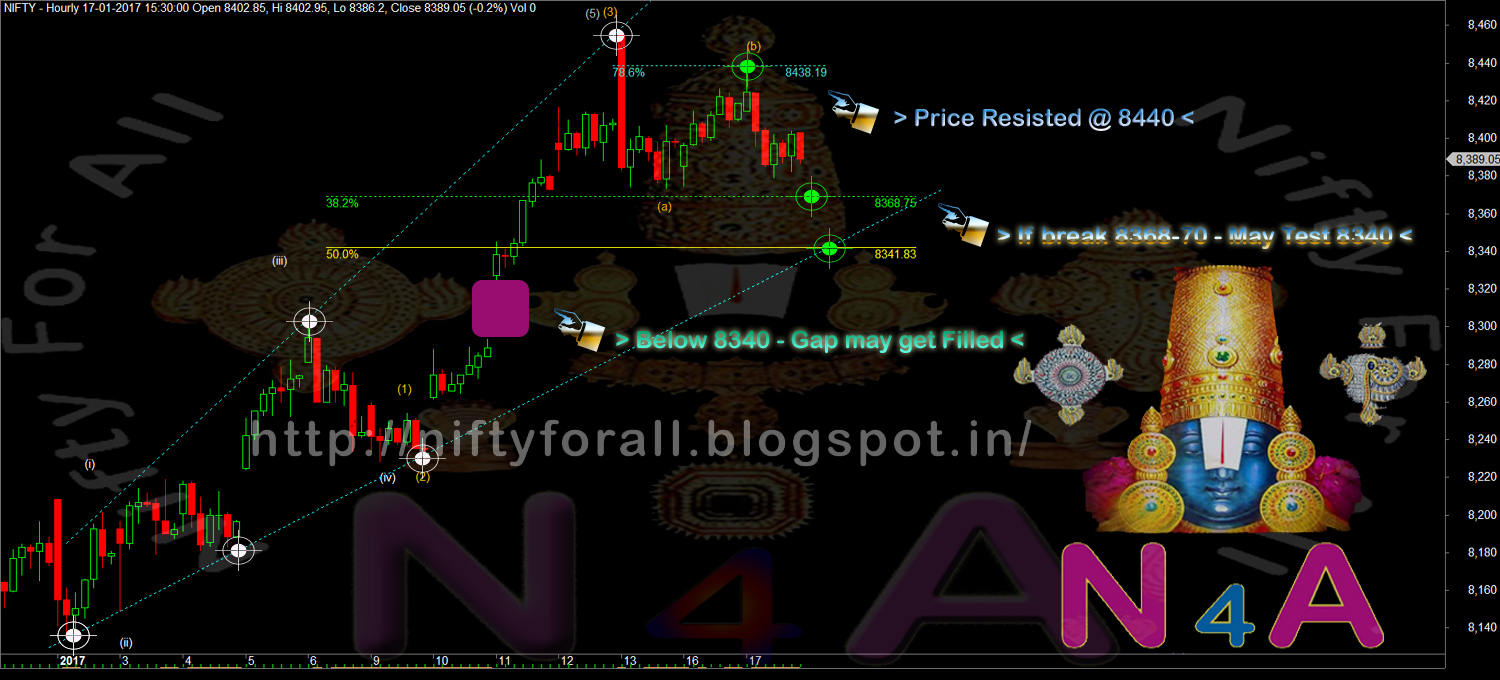
>>> Nifty Hourly Chart <<<
>>> Click the chart to see on full screen <<<
Last leg of rally was quite large and it took exactly 2 weeks to complete from Monday, 02nd Januaury to Friday 13th Januaury 2017.
>>> Bank Nifty Daily Chart <<<
>>> Click the chart to see on full screen <<<
Again a Hanging man at 50% retrace, so wait for next to confirm.
>>> Bank Nifty Hourly Chart <<<
>>> Click the chart to see on full screen <<<
Hourly chart suggest a completion of 1-5 upmove and a break below the channel may trigger a meaningful correction any time.
>>> Hindalco - Hourly Chart <<<
>>> Performance till 13th Jan, 2017 <<<
>>> Click the image to see on full screen <<<
Above performance is not a Promise or guarantee for the given Profits or Loss.Performance given based on 1 lot at a time and clients Profit differ as per the margin availability and Number of Lots taken by them. We may or may not re-enter the Calls given here hit Stop Loss, as per market movement. The charts given above are just for educational purpose only and we don't recommend any Entry / Buy or Exit / Sell. Reader must taken their own decision or consult their qualified Analyst before making any decision