
Macroeconomic Data:- The 'Big Three' indicators, viz IIP data, WPI inflation and retail inflation are likely to have a major say during the coming week. Among these, IIP data has already been released and the numbers are nothing but a total disappointment. Industrial output entered the negative territory in June, contracting 0.1 per cent mainly due to decline in manufacturing and capital goods sectors, reported PTI. Factory output, measured in terms of Index of Industrial Production, grew 8 per cent in June 2016. This is the first time in the current fiscal that the industrial output has shown a decline. The IIP grew by 3.4 per cent in April and 2.8 per cent in May as per the revised estimates released on Friday.
The inflation data based on wholesale price index (WPI) for July 2017 will be announced during market hours on Monday, August 14, 2017. WPI had eased sharply to its lowest level this year to 0.9 per cent in June from 2.17 per cent in May.
Retail inflation or consumer price-based inflation (CPI) for July 2017 will also be released on Monday after market hours. CPI had slowed to 1.54 per cent in June from 2.18 per cent in May.
Geopolitical tensions: The war of words between the US and North Korea escalated during the week as North Korea on Saturday said its army was on standby to launch attacks on the US.
North Korea’s state-run newspaper said its leader Kim Jung Un’s revolutionary army is “capable of fighting any war the US wants," reported New York Post.
Fed minutes:- The Federal Open Market Committee will issue minutes of its last monetary policy meet held on 26 July 2017, on Wednesday (August 16, 2017). As expected, the US Federal Reserve kept the policy rate unchanged at its latest meeting.
The Fed remained accommodative of monetary policy stance. However, it signalled the start of a reduction in balance sheet ‘relatively soon’ ((most likely in September). The movement of US dollar, precious metals and global indices will be keenly watched after the release.
>>> Nifty Weekly Chart - Posted Earlier Weekly Review <<<

>>> Click the chart to see on full screen <<<
On 31st July,2017 Weekly REview - Have Posted - Price may correct any time. See what happened.
>>> Nifty Weekly Chart - Fall may continue <<<

>>> Click the chart to see on full screen <<<
As expected - Price started falling. Expect more such correction also.
>>> Nifty Daily Chart - Posted on 11th Aug, 2017 <<<

>>> Click the chart to see on full screen <<<
Mentioned on Friday Post, Price may take support near 9680 or 9710.
>>> Nifty Daily Chart - Up move Possible <<<

>>> Click the chart to see on full screen <<<
Price made a Bullish candle near the channel support. 9710 or 9680 must hold.
>>> Nifty Hourly Chart <<<
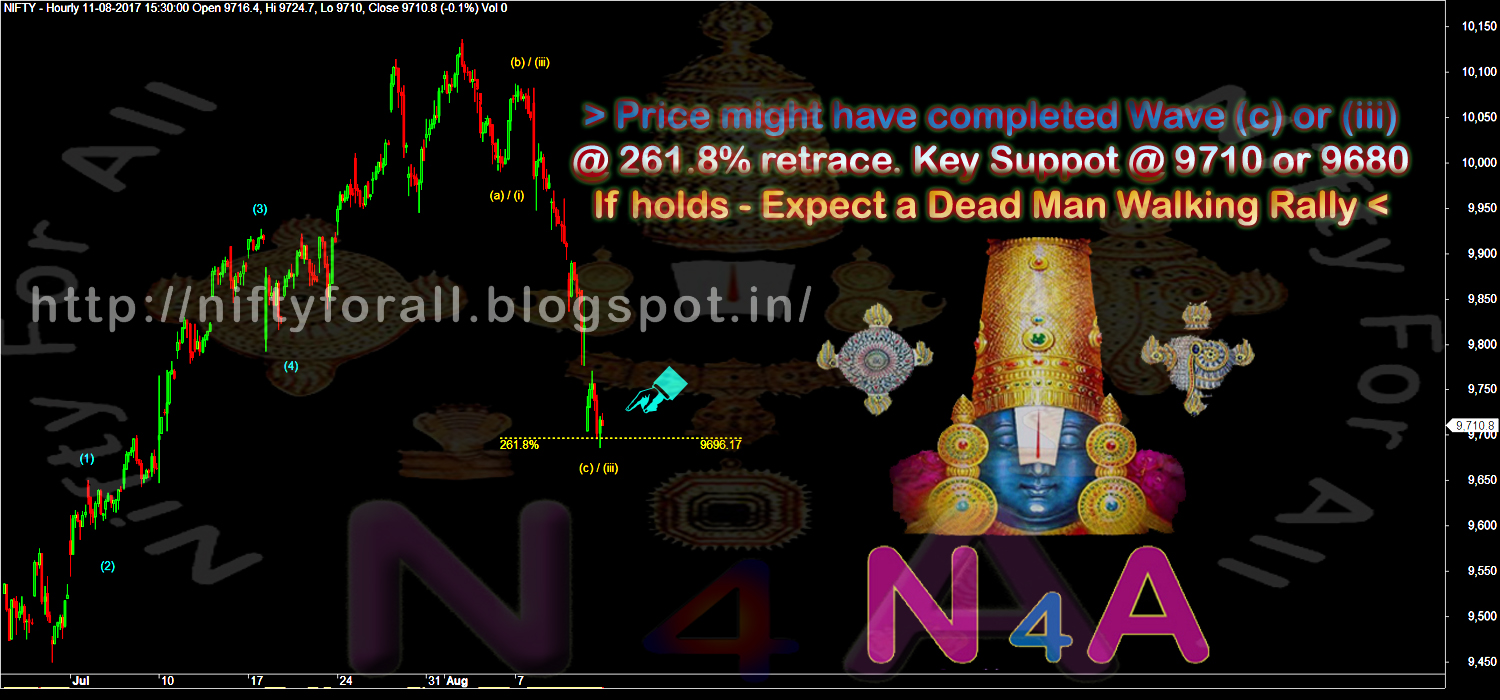
>>> Click the chart to see on full screen <<<
Price completed Wave c or iii. If this is not wrong - Expect some relief rally.
>>> Bank Nifty Weekly Chart - Posted on 31st July, 2017 Weekly Review <<<

>>> Click the chart to see on full screen <<<
Posted on 31st, July 2017 - Channel may Resist for a Possible Correction.
>>> Bank Nifty Weekly - Happened - Selling May Continue <<<

>>> Click the chart to see on full screen <<<
As expected Price started correcting.
>>> Bank Nifty Daily Chart <<<

>>> Click the chart to see on full screen <<<
Channel Support @ 23820-30 if Holds - Expect recovery.
>>> Bank Nifty Hourly Chart - Posted on 03rd Aug, 2017 <<<

>>> Click the chart to see on full screen <<<
Posted on 03rd Aug, Fall can be till 24070. See what happened.
>>> Bank Nifty Hourly Chart <<<

>>> Click the chart to see on full screen <<<
23820-30 Support.
>>> CNX-PHARMA - Posted on 31st July - Weekly Review <<<

>>> Click the chart to see on full screen <<<
Wrote as below 9450 - more fall.
>>> CNX-PHARMA - On Support <<<

>>> Click the chart to see on full screen <<<
Expect a Bounce Back Rally - If price hold the support line.
>>> Performance till 11th Aug, 2017 <<<

>>> Click the chart to see on full screen <<<
Above performance is not a Promise or guarantee for the given Profits or Loss.Performance given based on 1 lot at a time and clients Profit differ as per the margin availability and Number of Lots taken by them. We may or may not re-enter the Calls given here hit Stop Loss, as per market movement. The charts given above are just for educational purpose only and we don't recommend any Entry / Buy or Exit / Sell. Reader must taken their own decision or consult their qualified Analyst before making any decision.
>>> DRREDDY - What's Ahead <<<

>>> Click the chart to see on full screen <<<
Price if manage to hold with in 1-5 counts - Might be a Turn around story for the stocks. Lets wait and see for next week. Cheers!!!
>>> WhatsApp & N4A <<<
