Pages

Monday, February 29, 2016

Support - 6950 & 6870

Dear All,

>>> Nifty Hourly Chart <<<

>>> Click the chart to see on full screen <<<

It was a volatile day on Budget day. Two important supports breached during the day and managed to hold at the closing. No clarity and must wait for the price to breach on either side.

>>> DHFL - Posted on Weekly Review <<<

>>> Click the chart to see on full screen <<<

Wrote on weekly review - DHFL - We are long and looking for a good target. See what happened today.

>>> DHFL - Profit Booked <<<

>>> Click the chart to see on full screen <<<

Profit Booked @ 162. Cheers!!!

Saturday, February 27, 2016

Weekly Review - 29.02.2016

Dear All,


>>> ECONOMIC SURVEY <<<

The economic survey projected India to grow at 8% in the coming couple of year. Going forward, the Survey said the next year is expected to be a challenging one from the fiscal point of view. As per the road map, the centre's fiscal deficit should come down at 3.5% of country's gross domestic product (GDP) in 2016-17 from 3.9% in the current financial year.

As a cheer to the common people, it stated that consumption can rise if spending from higher wages and allowances of government workers on implementation of Seventh Pay Commission and return of normal monsoon occur.

On the flipside, the survey enumerated three downside risks - turmoil in global economy could worsen the outlook of exports, contrary to expectations oil price rise would increase the drag from consumption and the most serious risk is the combination of these two factors.

>>> GOING AHEAD <<<

Even though most global markets have dropped this year, India has emerged as a surprise underperformer, given its one-of-the-fastest-growing-economies tag.

Sakthi Siva, equity strategist at Credit Suisse, said India’s underperformance was likely to continue due to its valuation premium and also its slew of earnings downgrades.

“India’s premium to the region has dropped from a high of 55 per cent in September to 46 per cent currently. We note that historically India has always underperformed once its premium reaches 50 per cent,” said Siva in a note last week.


The consensus earnings downgrade in India was the biggest in the Asia Pacific region, the note added. India is one of the biggest underweight markets for Credit Suisse.

Outflows from overseas investors at $2.54 billion this year have been among the highest among emerging markets.

“Most investors have an overweight position on India. As the market is over-owned, the selling pressure is more. Last year local inflows were very strong, that too has weakened now. The reality is sinking in that the growth outlook is tough,” said Gautam Chhaochharia, head of research, UBS India.

Experts said concerns over the Union Budget, too, had weighed on the market performance.

“Investors have realised there are challenges around the Budget. It is not a simple scenario where the government can expand the fiscal deficit and stimulate growth. This is also clouding the outlook,” said Chhaochharia.

Worryingly, the fall in the market over the past year has hurt India’s record of being a market with superior risk-adjusted returns.

“MSCI India has been the third most volatile market since the global financial crisis. Only Brazil and Russia have seen higher volatility than India. Relatively higher returns helped India’s positioning on risk-adjusted return parameters. The trend has twisted a bit over the last year,” JPMorgan Analysts led by Adrian Mowat said in a note earlier this week.


>>> Nifty Weekly Chart <<<

>>> Click the chart to see on full screen <<<

Weekly Chart - Moving Averages - Nearing for a Death Cross. 200 WMA must hold for the Safety of Bulls.

>>> Nifty Daily Chart <<<

>>> Click the chart to see on full screen <<<

As Daily Chart suggest, some volatile ahead on budget week.

>>> Nifty Hourly Chart <<<

>>> Click the chart to see on full screen <<<

Hourly chart with an alternative, as per 4th wave completed and if so a bounce can be possible till 7090 or 7150 before next fall.

>>> Bank Nifty Weekly Chart <<<

>>> Click the chart to see on full screen <<<

Bank Nifty Weekly looks more scary. I use to say Bank Index is a pithamagan bhishma who decides the entire market. In a stressed economy - the first victims are banking stocks. If this is not wrong and if Banking index confirms that by breaking all support and indicators as given above, then bears are ready to stay more with us. Stocks are not going to find any bottom as every stocks going to be a falling knife.

>>> Bank Nifty Hourly Chart <<<

>>> Click the chart to see on full screen <<<

As a part of the current move, Above 13892 - Price may test the upper end of the channel as shown on chart.

>>> Stock - Follow Up <<<

>>> Apollo Tyre - Hourly Chart <<<

>>> Click the chart to see on full screen <<<

We have shorted @ 160 and holding for a good Fall. As shown on chart - if 100 HMA or 153.80 breaks - more fall ahead.

>>> Eicher Motor - Hourly Chart <<<

>>> Click the chart to see on full screen <<<

Holding Short on Eicher Motor also.

>>> DHFL - Hourly Chart <<<

>>> Click the chart to see on full screen <<<

We are long and expect a good rally above the channel or 154. Lets Wait and See. Cheers!!!

>>> Performance till 26th Feb, 2016 <<<

>>> Click the chart to see on full screen <<<

Kindly send your service queries to niftyforall@yahoo.com or whatsapp to 9677924975. Cheers!!!

Thursday, February 25, 2016

Support @ 6950

Dear All,

>>> Nifty Hourly Chart <<<

>>> Click the chart to see on full screen <<<

6950 must hold for bulls support.

>>> EICHERMOT <<<

>>> Click the chart to see on full screen <<<

We have Shorted Eicher Motor from 19050. Price broken trend line as shown on chart. Both Price and RSI - if continues to stay below the trend line - Fall to continue. We have short position from 19050. Lets Wait and see. Cheers!!!

Wednesday, February 24, 2016

Support @ 7015 & 6950

Dear All,

>>> Nifty Hourly Chart <<<

>>> Click the chart to see on full screen <<<

Nifty breaks all support and test 7010 and 7015. The patter changed again and we hit a 50 Points SL today. So now the counts should be abc-x- or Complted B wave near 7015. Now Price must hold 7015 or 9650 for a reversal move, else fall may continue. Cheers!!!

Tuesday, February 23, 2016

Support @ 7105 & 7078

Dear All,

>>> Nifty Hourly Chart <<<

>>> Click the chart to see on full screen <<<

Hope the bullish alternative with irregular wave 4 may get support at 7105 or 7078. Lets wait and see. Cheers!!!

Monday, February 22, 2016

Key Resistance @ 7270

Dear All,

>>> Nifty Hourly Chart <<<


>>> Click the chart to see on fulls screen <<<

7270 key resistance - If crosses - may try to fill the gap above as shown on chart. FnO Expiry / Rail & Union Budget may decide the trend. Cheers!!!

Saturday, February 20, 2016

Weekly Review - 22.02.2016

Dear All,


Markets gained over 3 per cent this week and made up for the losses incurred in the previous week due to value buying opportunity and positive global cues. Both the S&P BSE Sensex and the Nifty 50 regained psychologically important levels — the 23,000 level for the former and the 7,000 level for the latter.

Metal sector was the biggest gainer as People’s Bank of China set higher reference rate for the yuan against the dollar followed by value buying opportunity and stock-specific positive announcements in select public sector bank stocks.

Going ahead, markets are likely to remain volatile on account of the Budget session slated to begin from February 23 and expiry of derivative contracts.

Railway stocks as well as sectors relying on it, such as steel, cement, coal, iron ore and fertiliser, are likely to be in focus on account of the Railway Budget scheduled for February 25.

>>> Nifty Weekly Chart <<<

>>> Click the chart to see on full screen <<<

Price took support from 200 WMA. Last week Price almost near 50% of Previous Week Shows some positive momentum.

>>> Nifty Daily Chart <<<

>>> Click the chart to see on full screen <<<

Price may continue to rally, if RSI holds the break out as shown on chart.

>>> Nifty Hourly Chart <<<

>>> Click the chart to see on full screen <<<

7266 & 7366 acts as a Resistance. RSI on a IHS pattern. Above 7366 Price may zoom.

>>> Bank Nifty Weekly Chart <<<

>>> Click the chart to see on full screen <<<

Bank Nifty Weekly Chart - Got Support from 200 WMA.

>>> Bank Nifty Hourly Chart <<<

>>> Click the chart to see on full screen <<<

14590 & 14774 remains as a resistance for the current upmove.

>>> AdaniPort - Profit Booked <<<

>>> Click the chart to see on full screen <<<

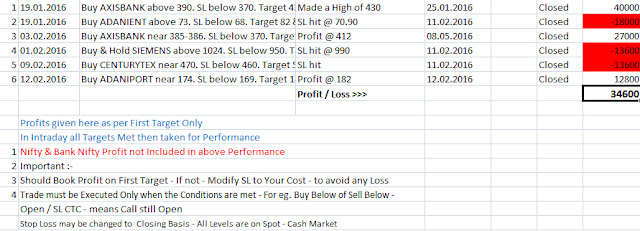
We have booked profit on Adaniport for the second time with Rs. 17600/-

>>> DLF - Profit Booked <<<

>>> Click the chart to see on full screen <<<

Buy given @ 81 and Booked Profit @ 89 with a Good Profit of Rs.40,000/-

>>> Crompton Greaves - Profit Booked <<<

>>> Click the chart to see on full screen <<<

Buy given @ 122 and Booked Profit @ 133 with a Good Profit of Rs.33,000/-

>>> Performance till 19th Feb, 2016 <<<

>>> Click the chart to see on full screen <<<

For service queries to niftyforall@yahoo.com or whatsapp @ 9677924975

Thursday, February 18, 2016

Above 7215 - More Rally

Dear All,

>>> Nifty Hourly Chart <<<

>>> Click the chart to see on full screen <<<

Above 7215 - Expect more rally.

>>> CROMPGREAV - Profit Booked <<<

>>> Click the chart to see on full screen <<<

Booked Rs.33,000/- Profit or 11 Points today. As per above chart, if price able to sustain above the given channel - more rally possible. Cheers!!!!

Wednesday, February 17, 2016

Resistance @ 7148. Support @ 6960 & 6940

Dear All,

>>> Nifty Hourly Chart <<<

>>> Click the chart to see on full screen <<<

Once again its a volatile session. Now Nifty faces resistance @ 7108 and 7148. Support @ 6960 & 6940. Lets wait for a Break on either side to decide. Cheers!!!

Tuesday, February 16, 2016

Key Support @ 7034

Dear All,

>>> Nifty Hourly Chart - Posted Yesterday <<<

>>> Click the chart to see on full screen <<<

Wrote Yesterday - as 7190 as a Key Resistance, See what happened.???

>>> Nifty Hourly Chart - Happened <<<

>>> Click the chart to see on full screen <<<

As wrote yesterday - Price resisted @ 7190 and started falling. Now the key support @ 7034 if breaks - may test 6995 & 6940 also. Lets wait and See. Cheers!!!

Monday, February 15, 2016

Key Resistance @ 7190

Dear All,

>>> Nifty Hourly - Posted on Hourly Chart <<<

>>> Click the chart to see on full screen <<<

Wrote on Weekly Review - We are Long. See what happened.

>>> Nifty Hourly - Happened - Booked Profit <<<

>>> Click the chart to see on full screen <<<

Nifty rallied as expected, Booked Near about 300-320 Profits.

>>> Axis Bank - Posted on Weekly Review <<<

>>> Click the chart to see on full screen <<<

Wrote on Weekly Review - Long on Axis Bank also. See what happened.

>>> Axis Bank - Profit Booked <<<

>>> Click the chart to see on full screen <<<

Profit Booked on Axis Bank @ 418 with a Profit of Rs.27000/-

>>> Adani Port - Posted on Weekly Review <<<

>>> Click the chart to see on full screen <<<

Wrote on Weekly Review - Have entered Adani Port for second time also. See what happened today.

>>> AdaniPort - Profit Booked <<<

>>> Click the chart to see on full screen <<<

Booked Profit near 188 with Rs.17600/-

>>> DLF - Profit Booked <<<

>>> Click the chart to see on full screen <<<

Made a Good Profit of Rs.40,000/- Cheers!!!

Saturday, February 13, 2016

Weekly Review - 15.02.2016

Dear All,


Key benchmark indices suffered huge losses, mirroring a sharp decline in the global equities as participants remained jittery on worries of a global economic slowdown. Volatility in crude oil prices and weakness in corporate earnings continued to haunt investors, resulting in persistent capital outflows.

In the week ended February 12, markets recorded the biggest weekly percentage drop since July 2009. The S&P BSE Sensex tanked 1,631 points, or 6.6 per cent, to settle below 23,000, at 22,986.12 and the broader Nifty plunged 508 points, or 6.7 per cent, to settle below 7,000, at 6,981.

Overall weakness in corporate earnings, correction in crude oil prices, liquidity crunch, government paralysis, inability to pass any major reforms such as Goods and Services Tax (GST), a tough stance by the Reserve bank of India, especially at a time when the world economies are looking at negative interest rates, rising non-performing assets (NPAs) are some of the other major reasons to add to the misery of markets

Federal Reserve chairwoman in a testimony to Congress stated that a global economic turmoil and massive sell-off in global equity markets could spook the US economy. Back home, India’s gross domestic product (GDP) expanded at a slower pace of 7.3 per cent in the December quarter of the current financial year, compared to a 7.7 per cent growth recorded in the September quarter. However, the GDP growth projection for the current financial year has been revised to 7.6 per cent. But amid the massive sell-off in global equities, investors ignored the growth estimates.

On Monday, markets are likely to react to the Consumer Price Inflation for January and Industrial Production data for December released on Friday. Index of Industrial Production (IIP) contracted an annual 1.3 per cent in December. Meanwhile, annual consumer price inflation edged up to a 17-month high of 5.69 per cent in January, driven up by higher food costs, according to a government data showed on Friday. Data on inflation based on the Wholesale Price Index (WPI) for January is due to be released by the government on Monday.

>>> Nifty Daily Chart <<<

>>> Click the chart to see on full screen <<<

Friday trade - gave a Red Color Hanging man. Need to wait and Watch.

>>> Nifty Hourly Chart <<<

>>> Click the chart to see on full screen <<<

Earlier - We have exited our Long below 7180 and re-entered long near 6870. Looking for some more rally.

>>> Bank Nifty Daily Chart <<<

>>> Click the chart to see on full screen <<<

Entire market changed when bank nifty breaks below 14740-80. Now next Support around 13300.

>>> Bank Nifty Hourly Chart <<<

>>> Click the chart to see on full screen <<<

14180 & 14400 acts as a resistance, as we may see some relief rally on bank nifty also.

>>> AXISBANK - HOURLY - FOLLOW UP <<<

>>> Click the chart to see on full screen <<<

Booked Axis Bank Profit two times and re-entered again. Hope will rally again.

>>> ADANIPORT - Hourly Chart <<<

>>> Click the chart to see on full screen <<<

We have booked a Profit of Rs.12800 on Friday and re-entered again. Lets See.

>>> Performance till 12th Feb, 2016 <<<

>>> Click the image to see on full screen <<<

Kindly send your queries about services to niftyforall@yahoo.com or whatsapp @ 9677924975

Wednesday, February 10, 2016

Where is the Bottom ?!?!?!?

Dear All,

>>> Nifty Daily Chart <<<

>>> Click the chart to see on full screen <<<

7180 tested today. As per above chart, We had it as last support. Must hold for a recovery.

>>> Bank Nifty Daily Chart <<<

>>> Click the chart to see on full screen <<<

14570-80 Second Support must hold for a recovery.

>>> Bank Nifty Hourly Chart <<<

>>> Click the chart to see on full screen <<<

Bank Nifty Hourly on a Clear Positive Divergence, If holds - Expect a good Recovery. Will it happen ??? Lets Wait for tomorrow. Cheers!!!