Dear All,
Indian equities climbed the most in 10 days, led by automakers, as Asian stocks ended a six-day run of losses after investor expectations for an US interest-rate increase eased and foreigners turned buyers of local shares for the first time in four days.
“Data shows that the US economy is still weak and a rate hike can happen only later,” said C.A. Rudramurthy B.V., head of research at Vachana Investments Pvt. in Bengaluru. “There are no negatives for the Indian markets right now, except the recent uncertainty about the Fed hike. We expect the liquidity-driven rally to continue.”
Globally, Asian stocks firmed on Friday after weak US data reduced already low expectations of an interest rate increase by the Federal Reserve next week, sending the Treasury yield curve surging to its steepest level in 2-1/2 months.
India's trade deficit declined sharply to 38.1% to $7.67 billion in August 2016 from $12.39 billion in August 2015. Exports fell 0.3% to $21.52 billion in August 2016 over August 2015. Imports fell 14.09% to $29.19 billion in August 2016 over August 2015.
The Bank of England unanimously voted to leave interest rates unchanged at record low of 0.25% after a monetary policy review yesterday and hinted of a rate cut as soon as November, despite the Brexit bounce back.
Foreigners bought $52 million of shares on Thursday after pulling $210 million in the previous three sessions as demand for risk assets cooled amid concern central banks are reluctant to boost stimulus. Foreigners have bought $6.2 billion of Indian equities this year, the most in Asia after Taiwan and South Korea.
Finance Minister Arun Jaitley on Friday expressed hope that the Reserve Bank will keep in mind the decline in retail inflation while deciding on interest rates at its policy review meeting on October 4.
>>> Nifty Daily Chart <<<
>>> click the chart to see on full screen <<<
Price and RSI got support from Channel, shows momentum may continue after some consolidation.
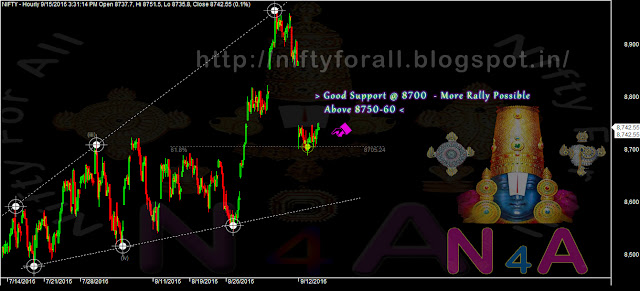
>>> Nifty Hourly Chart <<<
>>> click the chart to see on full screen <<<
Price may test 8690 or 8615 as shown on above chart.
>>> Bank Nifty Daily Chart <<<
>>> click the chart to see on full screen <<<
If 19720 breaks - Next Support can be @ 19190.
>>> Bank Nifty Hourly Chart <<<
>>> click the chart to see on full screen <<<
Can be an Irregular Correction mode on Bank Nifty Hourly Chart. Possible may test 19380 or below.
>>> SBIN - Booked Profit Rs.42000/- <<<
>>> click the chart to see on full screen <<<
Last Week - Made a Profit on SBIN - With Rs.42000/-
>>> AdaniPort - Booked Profit Rs.30,000/- <<<
>>> click the chart to see on full screen <<<
Last Week - Booked Profit on AdaniPort - Rs.30,000/-
>>> STAR - Posted on 12th September, 2016 <<<
>>> click the chart to see on full screen <<<
Wrote on 12th September - We have shorted for a good correction. See what happened.
>>> STAR - Booked Profit Rs.27500/- <<<
>>> click the chart to see on full screen <<<
Last Week - Booked Profit of Rs.27500/- on STAR.
>>> AdaniPort - Shorted Again - Expect a Correction Again <<<
>>> click the chart to see on full screen <<<
Price Resisted @ the Trend line - Possible Correction again. We have shorted and Holding for a good correction.
>>> Performance till 16th September, 2016 <<<
>>> click the chart to see on full screen <<<
Above performance is not a Promise or guarantee for the given Profits or Loss.Performance given based on 1 lot at a time and clients Profit differ as per the margin availability and Number of Lots taken by them. We may or may not re-enter the Calls given here hit Stop Loss, as per market movement. The charts given above are just for educational purpose only and we don't recommend any Entry / Buy or Exit / Sell. Reader must taken their own decision or consult their qualified Analyst before making any decision.


