Pages

Saturday, December 14, 2013

Weekly Review - 16.12.02013

Dear All,

Out Look for the Week :-

Market fell last week on worries of a rate hike by the central bank and fears of US Federal Reserve winding down its monetary stimulus measures. Rising inflation level in November and weak industrial output in October weighed on market sentiment.

>>>Week ahead<<<

Apart from policy reviews from the central banks of India and the US investors will be keenly watching corporate advance tax payments and inflation based on the wholesale price index.

The inflation data based on wholesale price index for November is scheduled for release on Monday, 16 December 2013.

The two-day meet of the US Federal Reserve Bank begins on Tuesday, 17 December 2013 while Reserve Bank of India will announce its Mid-quarter monetary policy review for 2013-14 on Wednesday, 18 December 2013.

>>> Nifty - Weekly Outlook <<<

>>> Click the chart to see on full screen <<<


Yes, I warned my clients about this fall on 10th Dec itself. Expanding Triangle & bearish engulfing on weekly chart gave a strong bear signal. So expect some bad news from international or domestic front for a possible fall in coming days. Readers those who have aggressive longs should stay cautious even if your not a short traders, maintain strict stop loss for any index or stocks you hold.


>>> Nifty - As Updates last week - Alternative 1 - Bearish Outlook <<<

>>> Click the chart to see on full screen <<<


Nifty made a big gap up on Last Monday due to 5 states election results, surpassed previous high at 6415, so our support levels changes now than last week.

>>> Happened and Yet to <<<

>>> Click the chart to see on full screen <<<


Looks like an a-b-c on the downside. Hence may fall as given on chart.

>>> Nifty - As Updated Last Week - Alternative 2 - Bullish Outlook <<<

>>> Click the chart to see on full screen <<<

As per second alternative wave 3 should be on the upper side, instead we saw a correction and so lets see what are the possibilities left for bull.

>>> Happened and Yet to <<<

>>> Click the chart to see on full screen <<<


On bullish alternative it should be sub wave (ii) on the downside and possible that it may take support at 6067 or 5972. If breaks these support then counts and bullish outlooks becomes invalid and may turn bearish

>>> BANK NIFTY - As Updated on 09th Dec, 2013 <<<

>>> Click the chart to see on full screen <<<


Above chart updated after big gap up opening on 5 State election results declared. Wrote that a-b-c-d-e pattern seems completed and a possible sell off.

>>> Happened and Yet to <<<

>>> Click the chart to see on full screen <<<


200 dma & channel should support for upmove. Else free fall should continue.

>>> BUZZING STOCKS <<<

>>> ICICI BANK - As updated on 12th Nov, 2013 <<<

>>> Click the chart to see on full screen <<<

>>> Happened and Yet to <<<

>>> Click the chart to see on full screen <<<

Reached both Target as expected and made a good Profit.

>>> NTPC <<<

>>> Click the chart to see on full screen <<<

Yes moving good and we are holding still. Booked some part profit also.

>>> PFC - As Updated on 12th Dec, 2013 <<<

>>> Click the chart to see on full screen <<<

>>> Happened and Yet to <<<

>>> Click the chart to see on full screen <<<

PFC - Booked good Profit. Still more downside left.

>>> MISSED CALLS <<<

>>> HCL TECH <<<

>>> Click the chart to see on full screen <<<

HCL TECH did not performed well and hit stop loss with a loss of 5500.

>>> PERFORMANCE <<<

For queries please write us to niftyforall@yahoo.com.

Thursday, December 12, 2013

Last Hope for Bull 6210-6200

Dear All,

>>> Click the chart to see on full screen <<<

Last hope 6210-6200, If break then free Fall. Else bounce back as usual. Lets See.

>>> PFC <<<

>>> Click the chart to see on full screen <<<

PFC broken down and looks like more fall ahead.

>>> HCL Tech <<<

>>> Click the chart to see on full screen <<<

HCL Tech hit sl. Exited with a loss of 5500.

Wednesday, December 11, 2013

Support 6246

Dear All,

>>> NIFTY - As Updated Yesterday <<<

>>> Click the chart to see on full screen <<<

Said Yesterday if breaks 6310 - more downside.

>>> Happened and Yet to <<<

>>> Click the chart to see on full screen <<<

As Said broken 6310 and made a low of 6280. Nifty trading between these levels - shows directionless. If unable to cross 6310 may trigger another fall till 6246. Sees like more volatile ahead.

>>> ICICI Bank <<<

>>> Click the chart to see on full screen <<<

Above chart was given yesterday - See what happened today...

>>> Happened and Yet to <<<

>>> Click the chart to see on full screen <<<

Yes First Target met with a Profit of 12500. More downside left if breaks the support line.

>>> NTPC <<<

>>> Click the chart to see on full screen <<<

NTPC - Looks Bullish - Buy on every dips.

>>> HCLTech<<<

>>> Click the chart to see on full screen <<<

Yes Highly Bearish on HCL Tech - Hope upmove almost ended. So get ready for fall. Cheers!!!

Tuesday, December 10, 2013

Correction or Consolidation ???

Dear All,

>>> NIFTY - As Updated Yesterday <<<

>>> click the chart to see on full screen <<<

Yesterday Said Nifty support as 6310. See what Happened.

>>> Happened and Yet to <<<

>>> click the chart to see on full screen <<<

6310 should hold tomorrow for upmove. Else 6246 should support bulls on next level.

>>> ICICI Bank <<<

>>> click the chart to see on full screen <<<

ICICI Bank Should continue its fall if breaks the middle line as shown on chart. We have booked Partial Profit. Lets See.

Monday, December 09, 2013

Its a "NaMo" Wave - Support 6310 & 6246

Dear All,

>>> Click the chart to see on full screen <<<

Yes its a NaMo Wave, broken all resistance and moving up. The Current upmove is Wave 3 and should pause the rally for sub wave 4 as shown on chart. Supports must be 6310 and 6246. Once the 4th sub wave gets completed, should resume the upmove once again as shown on chart.


>>> Bank Nifty <<<
>>> Click the chart to see on full screen <<<

Bank Nifty Completed a-b-c-d-e pattern. Lets See.

Saturday, December 07, 2013

Weekly Review - 09.12.2013


>>> MODI WAVE OR BEAR TRAP <<<

So Indian Markets moved up after exit polls projected a strong showing by the BJP. Market to react sharply On the Opening Bell on Monday, once the results are declared on Sunday.

Analyst expect 100 - 150 Points rally if the results came out as expected. But charts should be viewed with a third eye. Lets see whats Chart says ...

>>> NIFTY - BEARISH OUTLOOK <<<

>>> Click the chart to see on full screen <<<


Any surprise from Election results may trigger a sell off on the downside. As Nifty is over Bot and all predictions are in favour of bulls, any surprise or un-expected outcome on the results may trigger a heavy Sell off on nifty.

>>> NIFTY - BULLISH OUT LOOK <<<

>>> Click the chart to see on full screen <<<


So no wonder if BJP makes a sweeping victory on results. Nifty should make a 100 to 150 Pts gap up on the opening. So it must be a third wave upmove and should trigger a lot of short covering too. Lets See.

>>> BANK NIFTY - DAILY <<<

>>> Click the chart to see on full screen <<<


Bank Nifty facing key resistance from previous high 11812 if crossed may see 12334. So far the move looks like a corrective upmove Wave B. Cross above Fib level 78.6% should change the scenario. Lets wait and see.

>>> SBIN <<<

>>> Click the chart to see on full screen <<<


Explanations on chart.

>>> Block buster Chart <<<

>>> BHARTI AIRTEL <<<

>>> Click the chart to see on full screen <<<


>>> CIPLA <<<

>>> Click the chart to see on full screen <<<


>>> MISSED CALLS <<<

>>> ONGC <<<

>>> Click the chart to see on full screen <<<


>>> AXIS BANK <<<

>>> Click the chart to see on full screen <<<


>>> PERFORMANCE <<<

>>> Click the image to see on full screen <<<

Thursday, December 05, 2013

Game Over (or) Just Started ????

Dear All,

>>> Nifty - As Updated Yesterday <<<

>>> Click the chart to see on full screen <<<

Yesterday wrote clearly if 6153 holds then possible to bounce till 6262. See what happened today.
>>> Happened and Yet to <<<

>>> Click the chart to see on full screen <<<

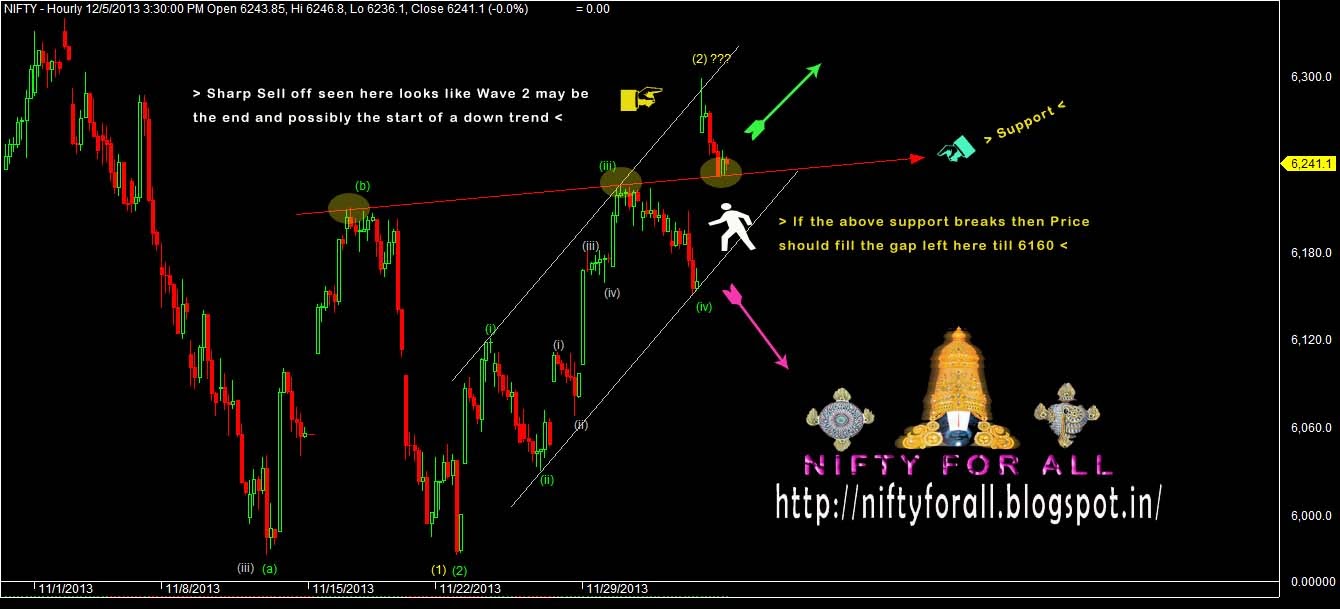
Exit polls gave a gap up and achieved the Levels given yesterday. Now Whats Next??? It looks like Wave 2 ended, but if the red support line holds possible bounce back again to 6275 and 6357. Lets See.

>>> Bank Nifty - As Updated Yesterday <<<

>>> Click the chart to see on full screen <<<

Bank Nifty said - A-B-C-D-E pattern and did an upmove as expected. But lets see one more alternative which is bearish also.

>>>> Happened and yet to <<<<

>>> Click the chart to see on full screen <<<

So given here is an bearish alternative. Hence the current upmove marked as Wave 2. Lets see.

Wednesday, December 04, 2013

Support 6153 & 6130

Dear All,

>>> Nifty - As updated yesterday <<<

> Click the chart to see on full screen <

Wrote yesterday, if 6190 breaks then nifty should fall.

>>> Happened and Yet to <<<

> Click the chart to see on full screen <

Yes, as per message send in the morning, Nifty fell down and took support at 6250. Next Support at 6230, if holds then possible upmove till 6262. Lets See.


>>> Bank Nifty <<<

> Click the chart to see on full screen <

Bank Nifty on A-B-C-D-E Pattern. Lets wait and See.

Tuesday, December 03, 2013

Time to Short ???

Dear All,

>>> Click the chart to see on full screen <<<

Market no more in a mood to test 6262 as wrote yesterday. Price moving out of Pitchfork Channel advises caution. 6190 if breaks then a fall must start. Lets See.

>>> CANBK <<<

>>> Click the chart to see on full screen <<<

Canara Bank not looking good on chart. Keep Resistance as SL as mentioned on chart and Sell on rise. If breaks the bottom support line, Free Fall not ruled out. Caution.

Monday, December 02, 2013

Resistance 6262

Dear All,

>>> Click the chart to see on full screen <<<

Nifty able to cross and hold above 6200 and 6210. Now 6262 act as an important resistance. As per yellow marking (bearish count) if unable to cross 6262 may trigger a sell off for third wave on the downside. Lets see.

>> Bharti Airtel - As Updated on Last Weekly Review >>

>>> Click the chart to see on full screen <<<

>>> Happened and Yet to <<<

>>> Click the chart to see on full screen <<<

First Target met and booked profit. Now if able to cross the wedge, more upside left.

>>> Missed Call - ONGC <<<

>>> Click the chart to see on full screen <<<

Yes ONGC Sell call failed. Loss 6700.

Friday, November 29, 2013

Weekly Review :-02.12.2013

Dear All,

>>> Nifty - As Updated on Friday <<<

>>> Click the chart to see on full screen <<<

Wrote Yesterday about Possible bullish break out on chart.

>>> Happened and Yet to <<<

>>> Click the chart to see on full screen <<<

As said broken out and more fire works above 6200. If GDP is good, Short Sellers must be cautious.

>>> Bharti Airtel <<<

>>> Click the chart to see on full screen <<<

Yes we are holding Long in Bharti Airtel. Have booked Part Profit. Looking for a good break out soon.

>>> Syndicate Bank <<<

>>> Click the chart to see on full screen <<<

Syndicate Bank done our first Target. More upmove coming for next 2 targets also.

>>> Cipla <<<

>>> Click the chart to see on full screen <<<

Already wrote last week about Cipla - formed an a-b-c-d-e patter. Today gave a Break out on Hourly chart. Yes we are long in this counter. Buying on every dips is advisable.

>>> NHPC <<<
>>> Click the chart to see on full screen <<<

Yes, Just buy it for good target on the upper side.

>>> PERFORMANCE <<<

>>> Click the image to see on full screen <<<

Thursday, November 28, 2013

Resistance 6114 & 6200

Dear All,

>>> Click the chart to see on full screen <<<


On bullish alternative, its seems like we are on the edge of break out. Key resistance 6114 and 6200. Now if breaks these resistance we may see a rally coming in.