>>> Nifty Hourly Chart <<<

>>> click the chart to see on full screen <<<
Price below 50 HMA. Next Support @ 8090 and 8055. Choppy Volatile till it breaks and closed below these two support levels. Till then no direction. Lets wait for it. Cheers!!!
>>> click the chart to see on full screen <<<
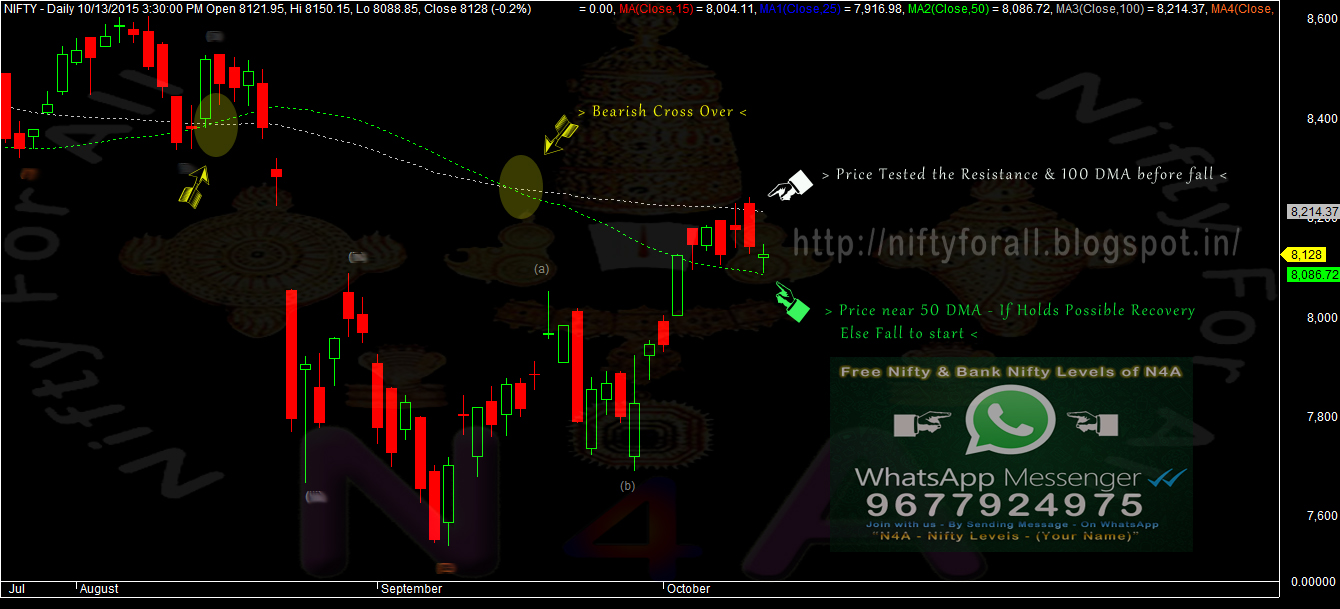
>>> Click the chart to see on full screen <<<

>>> Click the chart to see on full screen <<<

>>> Click the chart to see on full screen <<<

>>> Click the chart to see on full screen <<<

>>> Click the chart to see on full screen <<<

>>> Click the chart to see on full screen <<<

>>> Click the chart to see on full screen <<<

>>> Click the chart to see on full screen <<<

>>> Click the chart to see on full screen <<<

>>> Click the chart to see on full screen <<<

>>> Click the chart to see on full screen <<<

>>> Click the chart to see on full screen <<<

>>> Click the chart to see on full screen <<<

>>> Click the chart to see on full screen <<<

>>> Click the chart to see on full screen <<<

>>> Click the chart to see on full screen <<<

>>> Click the chart to see on full screen <<<

>>> Click the chart to see on full screen <<<

>>> Click the chart to see on full screen <<<

>>> Click the chart to see on full screen <<<

>>> Click the chart to see on full screen <<<

>>> Click the chart to see on full screen <<<

>>> Click the chart to see on full screen <<<

>>> Click the chart to see on full screen <<<Crossed above 7930 and next resistance @ 7984 and 8022. Positive Data Like Core Sectors and Global Markets Rally may help index to open positive once again tomorrow. Lets wait and see. Cheers!!!

>>> Click the chart to see on full screen <<<

>>> Click the chart to see on full screen <<<

>>> Click the chart to see on full screen <<<

>>> Click the chart to see on full screen <<<


>>> Click the chart to see on full screen <<<

>>> Click the chart to see on full screen <<<

>>> Click the chart to see on full screen <<<

>>> Click the chart to see on full screen <<<

>>> Click the chart to see on full screen <<<

>>> Click the chart to see on full screen <<<

>>> Click the chart to see on full screen <<<

>>> Click the chart to see on full screen <<<

>>> Click the image to see on full screen <<<

>>> Click the chart to see on full screen <<<

>>> Click the chart to see on full screen <<<

>>> Click the chart to see on full screen <<<

>>> Click the chart to see on full screen <<<

>>> Click the chart to see on full screen <<<

>>> Click the chart to see on full screen <<<

>>> Click the chart to see on full screen <<<

>>> Click the chart to see on full screen <<<

>>> Click the chart to see on full screen <<<

>>> Click the chart to see on full screen <<<

