Pages

Tuesday, June 16, 2015

Above 8052

Dear All,

>>> Nifty Hourly Chart <<<

>>> Click the chart to see on full screen <<<
Price closed above 50 HMA and Yesterday high. So expect some more rally tomorrow also.

>>> GRASIM <<<

>>> Click the chart to see on full screen <<<
We are long in Grasim since 3320. Price made a high today @ 3389. Part Booking advised for Rs.5000 or near 3375. Now if the Price continue to stay above the wedge, Expect more rally soon.

>>> INDUSINDBK <<<

>>> Click the chart to see on full screen <<<
Buy initiated above 802 and Booked near 822 intrday with a Profit of Rs.5000. More rally possible towards 830 and 845. Cheers!!!.

Monday, June 15, 2015

Resisted @ 50 HMA @ 8052

Dear All,

>>> click the chart to see on full screen <<<

Price Resisted @ 50% retrace or 50 Hour Moving Average near 8052. Cross above may give some more rally towards the channel top. Lets See. Cheers!!!

Sunday, June 14, 2015

Weekly Review - 15.06.2015

Dear All,

It was a real nightmare on market last week. Almost every Stock and Index moved into Profit - suddenly returned and hit Stop Loss. It all happened every after a good Break out Price and Indicators, shows the strength of Bear also.
Our Stocks like Bata India - ACC - Tata Motors - BataIndia - almost made a Profit of Rs.5000 and above and returned to hit Stop loss due to heavy volatile.
After a RBI's Rate Cut - which was below market expectation - Market turned down, Next week will be decided as per the progress in Monsoon.
Monday market may open on Positive zone - due to positive IIP data and CPI data. FED Meeting next week decide the course also. Progress in crude Prices - Saudi market Opened for Global investors - China Progress may decide the trend. Weakness in forex may impact the equity market heavily.
Lets go to technicals.

>>> Nifty Weekly Chart - Posted on Last Weekly Review <<<

>>> Click the chart to see on full screen <<<

Last Weekly Review - wrote - How far 8000 and 7960 important. See what happened.

>>> Nifty Weekly Chart - Happened <<<

>>> Click the chart to see on full screen <<<

Nifty tested both 8000 and 7960. Now the base 7960 looks very important. Since the price holding below 50 WMA, Below 7960 may test 7723 at any cost.

>>> Nifty Daily - Happened <<<

>>> Click the chart to see on full screen <<<

We have exited our Long with a Loss of 100 Points. Lets see whats next on 5 Mins chart.

>>> Nifty 5 Mins Chart <<<

>>> Click the chart to see on full screen <<<

7950 - Key Support if holds, then expect a bounce as shown on chart. If this analysis is not wrong, an expanding triangle formation on card. Hence if the channel resistance or Expanding triangle resist the price, a fall may resume again towards the given target as shown on chart.

>>> Bank Nifty Weekly Chart <<<

>>> Click the chart to see on full screen <<<

Hope the above weekly chart for Bank Nifty is very simple to understand. If the First channel or 50 WMA breaks, expect a fall towards second Support line or 100 Week Moving Average.

>>> Bank Nifty Hourly Chart <<<

>>> Click the chart to see on full screen <<<

Not sure about the above count. Price may be forming an Expanding triangle for Wave X. On the other side if the two support 17175 and 16800 breaks, Price may continue to fall towards the lower side. One can refer the weekly chart for the downside target.

>>> ACC - Posted on 06th June, 2015 <<<

>>> Click the chart to see on full screen <<<

05th June, We have update our ACC position - As we hold long. See what happened

>>> ACC - Happened <<<

>>> Click the chart to see on full screen <<<

ACC Hit SL @ 1420. We have no Position right now. Above chart shows that - a Possible Bullish Wolf Wave formation. If this is not wrong, Expect some bounce from here.

>>> TATAMOTORS - Posted on 10th June, 2015 <<<

>>> Click the chart to see on full screen <<<

Mentioned that the Price may take support @ 430-32 as the price retraced as W-X-Y. See what happened.

>>> TATAMOTORS - Happened <<<

>>> Click the chart to see on full screen <<<

A Profit of Rs.5000 returned to Loss, SL hit and Exited Long. Next Support at 390.

>>> TECHM - Posted on 10th June, 2015 <<<

>>> Click the chart to see on full screen <<<

Wrote to Buy Tech Mahendra for a good Upmove. See what happened.

>>> TECHM - Happened <<<

>>> Click the chart to see on full screen <<<

We Booked Profit 5000 and Exited.

>>> BATAINDIA - As posted on 03rd June, 2015 <<<

>>> Click the chart to see on full screen <<<

Bata India entered Long at 1010 - Which moved till 1045 which was our first Target. We Carried for the second target - which failed and hit the Stop loss. Due to heavy volatile - we missed our profit of Rs.7500 and met a loss of Rs.8750.

>>> TCS <<<

>>> Click the chart to see on full screen <<<

Booked Rs.5000 and Exited @ 2580.

>>> Performance - as on 12th June, 2015 <<<

>>> Click the chart to see on full screen <<<

for details of service - send email to niftyforall@yahoo.com

Thursday, June 11, 2015

Nifty Breaks 8000. So whats the Next Alternative ??

Dear All,

>>> Nifty Daily Chart <<<

>>> Click the chart to see on full screen <<<

Broken 8000. Now Wave C is getting extended as a-b-c-d-e. Price if stays below 8000, Possible downside movement may be still 7723.
We have exited all Long. We don't recommend any long or short at present stage - since all indicators are highly over sold and tomorrow is a weekend closing. Lets wait and See - What to be done Next. Cheers!!!

Wednesday, June 10, 2015

Is this a Bull Trap or Bear Trap ?!?!?!?

Dear All,

>>> Nifty - Hourly Chart <<<

>>> Click the chart to see on full screen <<<

US index provider MSCI Inc on Tuesday deferred enlisting China A shares in the index, was an relief for other emerging market investors - including India. Market started moving up since today morning.

As wrote earlier - Nifty was clearly holding 8000 till Yesterday and started moving upward. Today Price able to cross and close above 8116 shows the strength of bulls.

Next - Key resistance 8183 - should cross for any further rally or upside. RSI must give a break out as shown on chart.

One more good News - after market hours as follows.

The government's current account deficit narrowed to $1.3 billion, or 0.2 per cent of gross domestic product, in the January-March quarter from $8.3 billion, or 1.6 per cent of GDP in the previous quarter, the Reserve Bank of India said on Wednesday.

That compared to $1.2 billion in the January-March quarter of 2014, the Reserve Bank of India said.
But the balance of payment stood at a surplus of $30.1 billion during January-March, a sixth consecutive quarter of surplus.

The trade deficit in the January-March period narrowed to $31.7 billion from the previously reported $39.2 billion a quarter ago.

>>> TATAMOTORS <<<

>>> Click the chart to see on full screen <<<

If this count is not wrong, Expect a good bounce from here.

>>> TECHM <<<

>>> Click the chart to see on full screen <<<

Wave A completed on Tech Mahindra, Now a bounce for Wave B - may fill the gap above - as shown on chart. Cheers!!!

Monday, June 08, 2015

CHINA Vs INDIA - Only 8000 to decide -

Dear All,


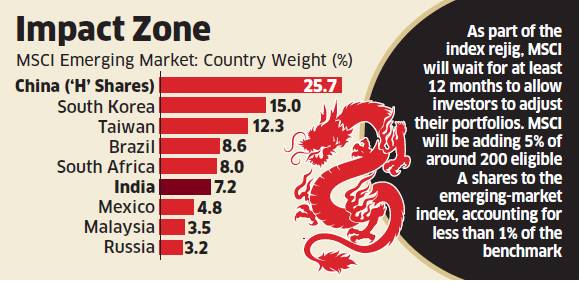
>>> CHINA on MSCI Index - May Spook Indian Market <<<


The outcome of a meeting on June 9 of the committee that constructs the MSCI Emerging Market Index — a key benchmark used by global fund managers to invest — may have repercussions for the Indian stock market.

If the decision to include 'China A' shares in MSCI Emerging Market index finds acceptance, the weight of the Chinese markets would increase in MSCI index, which may result in passive funds reducing their exposure to Indian equities and redeploying their funds in China.

China A shares are stocks that are denominated in yuan and traded on Shanghai and Shenzhen stock exchanges. Analysts say that if China A shares are included in MSCI index, the weight of China is likely to increase by 13% to 38% in MSCI Emerging Market Index.


Foreign portfolio investors (FPIs) own 22% of total equities in India while these hold only 5.7% of mainland Chinese equities. Thus, if China continues to remove the restrictions on foreign funds, there is headroom for funds to move to China. MSCI is expected to include 'A' shares in phases over the next one year to minimise volatility in other markets. As part of the index rejig, MSCI will wait for at least 12 months to allow investors to adjust their portfolios. MSCI will be adding 5% of around 200 eligible A shares to the emerging-market index, accounting for less than 1% of the benchmark.

China may attract about $2 billion from funds tracking the index following the initial inclusion. Some experts believe the impact on India could be less dramatic.

In case of full inclusion, India's weight may come down to 4.5% from 7.2% at present. Out of the $330-billion asset under management of foreign funds in India, 21% is invested by the emerging market funds.

Thus, any reallocation by these funds could rattle Dalal Street.

Currently, 25% of the MSCI EM index is composed of mainland Chinese companies listed in Hong Kong. Such stocks are known as 'H' shares. Inclusion of China 'A' will also have huge implications in the way global portfolio managers play the EMs which equity attract investments of $1.7 trillion — a number that's close to India's GDP


>>> Nifty Hourly Chart <<<

>>> Click the chart to see on full screen <<<

May be market looking for some triggers like MSCI Index as mentioned above. For these days INdian INdex continues to feel the pressure while Chinese kept going Up, shows the importance of it.
Tomorrow - after the outcome of MSCI - results may impart heavily - both indian and Chinese index. (Mostly china on Wednesday Morning )

Ofcoruse we need to go technically and hence we should watch the important supports like 8022, 8000 or 7960 if breaks may shows more weakness. So far the Hourly Index showing some sort of positive divergence from RSI. Lets hope the best. Cheers!!!

Saturday, June 06, 2015

Weekly Review 08.06.2015

Dear All,

>>> Nifty Weekly Chart <<<

>>> Click the chart to see on full screen <<<

Above weekly Chart - Shows how the Candle Sticks played an important role so far. Bearish Doji on the top confirmed the fall, while a Hammer and Doji at the bottom of the chart near 8000 and 7960 made a base for the bulls.

But last week candle was a bearish engulfing, which closed below previous three candles and 50 Week moving average is a concern for the bulls now.
So next week is going to be decision making week for bulls and bears.

8000 and 7960 going to play a key role, if breaks below may give strength for bear and the fall may continue.

>>> Nifty Daily Chart <<<

>>> Click the chart to see on full screen <<<

An example chart given above, which was like a mirror on the daily chart - Shows that the Grave Stone doji near 161.8% retrace looks like a Bullish one. As mentioned on the chart, if the price closed below 8000 or 161.8% retrace, then the fall may continue.

>>> Nifty Hourly Chart <<<

>>> Click the chart to see on full screen <<<

On Hourly chart - Last 2 and half day fall had a Positive Divergence from RSI. A break below 8046 or 8060 may confirm the downtrend with more fall.

>>> Bank Nifty Weekly Chart <<<

>>> Click the chart to see on full screen <<<

It was on the RBI's Rate Cut changed the entire way of the market, Particularly Bank Nifty. Above Weekly Chart shown the Bearish Engulfing Candle - which closed below the previous three candle - shows the strength of the fall and Bear.
Now its the Channel Support and 50 Week Moving Average to decide the way and trend of the Bank nifty. Break below the Channel support and 50 WMA may confirm the fall further.

>>> Bank Nifty Daily Chart <<<

>>> Click the chart to see on full screen <<<

Price below 200 DMA. Last hope is the Channel and Previous Low 17250, if breaks, fall to continue. Else - As mentioned on chart, Price is moving for a 5th wave and Subwave (iii) must start for a good rally.

>>> Bank Nifty Hourly Chart <<<

>>> Click the chart to see on full screen <<<

Just like Nifty - Bank Nifty also had a positive divergence on RSI. Lets see how it react next week.

>>> Stock for the Week <<<

>>> BATA INDIA - As Posted on 03rd June, 2015 <<<

>>> Click the chart to see on full screen <<<

Wrote - Bata India - As our Holding. After making a rally towards 1045, stock reversed. See whats next !!!

>>> BATA INDIA - Happened <<<

>>> Click the chart to see on full screen <<<

Wave B forming an abcde pattern, If breaks below the given support, fall to continue, Else Price may bounce again.

>>> ACC - As Posted on 04th June, 2015 <<<

>>> Click the chart to see on full screen <<<

Wrote on 04th June, 2015 - about our long on the stock. But the Price did not moved up as expected. Lets see whats next !!!

>>> ACC - Happened <<<

>>> Click the chart to see on full screen <<<

Good Support @ 1420, breaks below, Fall may continue.

>>> TCS - Hourly Chart <<<

>>> Click the chart to see on full screen <<<

We are short on TCS from 2620, looking for a more fall. Cheers!!!

Thursday, June 04, 2015

Brave Hearts - Buy Now.

Dear All,

>>> Nifty Daily Chart <<<

>>> Click the chart to see on full screen <<<

Bullish Hammer on Daily Chart. Previous such candle yielded a good result. Lets see how it works this time ???

>>> Bank Nifty Hourly <<<

>>> Click the chart to see on full screen <<<

Bank Nifty retraced 161.8% of Wave A, and tested the channel as shown on chart. We entered Long today near 17530 and now with a Profit of almost 200 Points. Expecting more rally soon.

>>> ACC - Hourly Chart <<<

>>> Click the chart to see on full screen <<<

Expecting a rally on the above stock. Cheers!!!

Wednesday, June 03, 2015

Are You Still Bearish ???

Dear All,

>>> Nifty Hourly Chart - Posted Yesterday <<<

>>> Click the chart to see on full screen <<<

Yesterday - Wrote clearly - More fall likely on Nifty - See what happened today.

>>> Nifty Hourly Chart - Happened today <<<

>>> Click the chart to see on full screen <<<

As expected Nifty tested the 2nd Support @ 8102. The current fall is for wave C, which is almost 161.8% of Wave a. If this analysis is not wrong, and if 8102 support holds, expect a good rally from here. Yes, We have entered long here.

>>> Bank Nifty Hourly - Posted Yesterday <<<

>>> Click the chart to see on full screen <<<

Wrote on Bank Nifty also, Yesterday - More fall likely to fill the gap left on the downside. See what happened today.

>>> Bank Nifty Hourly - happened <<<

>>> Click the chart to see on full screen <<<

Bank Nifty tested 17600 or tested the Break out Channel as shown on Chart. But the gap is yet to be filled. But if the support @ 17600 holds then Look for a rally, We have no Position Yet in BN.

>>> BATAINDIA <<<

>>> Click the chart to see on full screen <<<

We are Long in Bata India from 1010, Expecting a good rally above the wedge. Cheers!!!

Tuesday, June 02, 2015

Is This a Trend Reversal ???? Bull Market Over ????

Dear All,

>>> Nifty Hourly Chart <<<

>>> click the chart to see on full screen <<<

Yesterday (On Monday) we have advised our clients to book 50% of the long, as it breaks some important support levels as mentioned on chart. Yesterday when nifty 8424 and Bank Nifty 18645 and 18600 - when it breaks - we asked less risky traders to book full or atleast 50% of the long.

So today market can't hold any of the supports like 8270 or 8245 and fell heavily. Next support like 8185 and 8102 may be on card.

>>> Bank Nifty Hourly Chart <<<

>>> click the chart to see on full screen <<<

Yesterday (On Monday) - We have alerted our clients - when BN Spot breaks important support 18645, send message to book atleast 50% profit on Long taken at 18360.

Today when BN Spot breaks 18230 - we advised to exit remaining long also.

Now above chart - shows 17980 is an important support, if breaks - then price may try to fill the gap left on the downside.

Monday, June 01, 2015

Support @ 8390 & 8365

Dear All,

>>> Nifty Hourly Chart <<<

>>> Click the chart to see on full screen <<<

As we have mentioned on our Morning message on whatsup, Nifty resisted @ 8470. Tomorrow is a event day, RBI day. Price if unable to hold 8424, then may test the support at 8390 and 8365 before a bounce.

>>> Event Day - RBI's Monetary Policy <<<

Tomorrow is a day for Bank Nifty - To decide trend of the Market also.

Q4 GDP & HSBC's India's Manufacturing PMI - encouraging and better than expected. Monsoon is likely to arrive in kerala any time soon. Hence - So far data's are in Positive zone only.

Corporate results declared so far are not good or even dis-appointing. So RBI under heavy pressure to Cut the Rate.

Lets Also see Technical view on chart...

>>> Bank Nifty Daily Chart <<<

>>> Click the chart to see on full screen <<<

Above is a Daily Chart of Bank Nifty. Today Price resisted at 100 Day Moving Average. But RSI in a clear Break out Zone, Means nothing to worry for the time being. Of course Price closed below 18645 or 38.2% retrace should be watched. Lets also see in detail in 5 Minit chart.

>>> Bank Nifty 5 Minit Chart <<<

>>> Click the chart to see on full screen <<<

Above is a 5 Minit chart for Bank Nifty. It reveals how far Price moved up inside the channel. If this analysis is not wrong, then the move should be like ABCDE or ABC-X-ABC. 18600 or 18528 or Channel may support the bulls tomorrow. Chart suggest that the correction may used to buy on dips.


>>> BANKBARODA <<<

>>> Click the chart to see on full screen <<<

We are long since 161 in BankBaroda. Clear break out on chart suggest more rally possible. Waiting for a good Target. Cheers!!!