Pages

Tuesday, July 11, 2017

Next Resistance @ 9830-40

Dear All,

>>> Nifty Hourly Chart <<<


>>> Click the chart to see on full screen <<<


Price made a Break out above 9710 and now facing a resistance near 9830-40.

>>> NiftyMidCap50-DailyChart-Posted on Weekly Review <<<


>>> Click the chart to see on full screen <<<

Posted on Weekly Review 4720 as a Resistance.

>>> NiftyMidCap50-DailyChart - Caution Advised <<<

>>> Click the chart to see on full screen <<<

Price corrected almost a 95 points. 4720 if not crossed, caution advised on all midcap stocks.

>>> CNXMetal-Daily-Chart-Caution Advised <<<

>>> Click the chart to see on full screen <<<

Metal Stocks and Metal Index looks bearish to me. Key Resistance 3150 if not crossed, Expect sharp correction. Caution on all Metal Stocks also.

>>> VEDL_Daily_Chart - We are Short <<<

>>> Click the chart to see on full screen <<<

Key Resistance 163-164 if not Crossed - Expect a Sharp Correction in VEDL. We have shorted at higher level and holding. Cheers!!!

Saturday, July 08, 2017

Weekly Review - 10th July 2017

Dear All,


>>> Nifty Weekly Chart <<<

>>> click the chart to see on full screen <<<

Fifth time Price unable to cross 9660-70 must be taken care with Caution.

>>> Nifty Daily Chart - Posted Last Weekly Review <<<

>>> click the chart to see on full screen <<<

Last Week mentioned that 9450 as a Good Channel support. See what happened.

>>> Nifty Daily Chart - Profit booked Rs.20,000/- <<<<

>>> click the chart to see on full screen <<<

As expected Price Rallied from 9450 and We Booked near 9690 and a Good Profit.

>>> Nifty Hourly Chart - Posted Last Weekly Review <<<

>>> click the chart to see on full screen <<<

Posted Last Weekly Review as an Expanding Triangle.

>>> Nifty Hourly Chart - Resisted @ 9700 <<<

>>> click the chart to see on full screen <<<

9700 Stiff resistance.


>>> BankNifty Daily Posted - Last Weekly Review <<<

>>> click the chart to see on full screen <<<

Wrote last weekly review 23000 was a good support.

>>> Bank Nifty Daily - Next Resistance @ 23550-560. <<<

>>> click the chart to see on full screen <<<

Next Resistance @ 23550-560.

>>>> Bank Nifty Hourly Chart <<<<

>>> click the chart to see on full screen <<<

Hourly chart also Suggest 23550-560 as Resistance.

>>> CNXIT - Daily Chart <<<

>>> click the chart to see on full screen <<<

Unable to hold the trend line support.

>>> CNXIT - Hourly Chart <<<

>>> click the chart to see on full screen <<<

Support @ 10040-45 if Holds - may rally again, Else fall to continue. Watch IT Stocks.

>>> CNXPSUBank-Daily_Chart-Resistance @ 3410-3420 <<<

>>> click the chart to see on full screen <<<

3410-3420 - if manages to Cross above - Next Rally to Start - Watch PSU Bank Stocks.

>>> CNX_MIDCAP50_INDEX-Daily Chart <<<

>>> click the chart to see on full screen <<<

MidCap Index on rally Mood, Key Resistance @ 4655 & 4720.

>>> LUPIN - Posted 05th July, 2017 <<<

>>> click the chart to see on full screen <<<

Posted on 05th July, We are Long in LUPIN

>>> LUPIN - Profit Booked Rs.20,000/- <<<

>>> click the chart to see on full screen <<<

Booked Luping with Rs.20,000/- Profit.


>>> IRB - Posted on 03rd July, 2017 - <<<

>>> click the chart to see on full screen <<<

Posed on 03rd July, We are Long

>>> IRB - Booked Profit Rs.25000/- <<<

>>> click the chart to see on full screen <<<

Booked Rs.25000/- Profit on 06th July, 2017.

>>> RBLBank - Daily Chart - We are Long <<<

>>> click the chart to see on full screen <<<

Its a Break out and we are long for a Rally.

>>> Performance till 07th July 2017 <<<

>>> click the image to see on full screen <<<

Above performance is not a Promise or guarantee for the given Profits or Loss.Performance given based on 1 lot at a time and clients Profit differ as per the margin availability and Number of Lots taken by them. We may or may not re-enter the Calls given here hit Stop Loss, as per market movement. The charts given above are just for educational purpose only and we don't recommend any Entry / Buy or Exit / Sell. Reader must taken their own decision or consult their qualified Analyst before making any decision

Thursday, July 06, 2017

Resisted @ 9700

Dear All,


>>> Nifty Hourly Chart - Posted Yesterday <<<

>>> Click the chart to see on full screen <<<

Wrote Yesterday - 9700 as a Resistance.

>>> Nifty Hourly Chart - Booked Profit Rs.20,000/- <<<

>>> Click the chart to see on full screen <<<

Booked Profit today with Rs.20K.

>>> IRB Hourly - Posted on 03rd July 2017 <<<

>>> Click the chart to see on full screen <<<

Posted on 03rd July - We are Long.


>>> IRB - Booked Profit Rs.2500/- <<<

>>> Click the chart to see on full screen <<<

Booked Profit Rs.25000/-

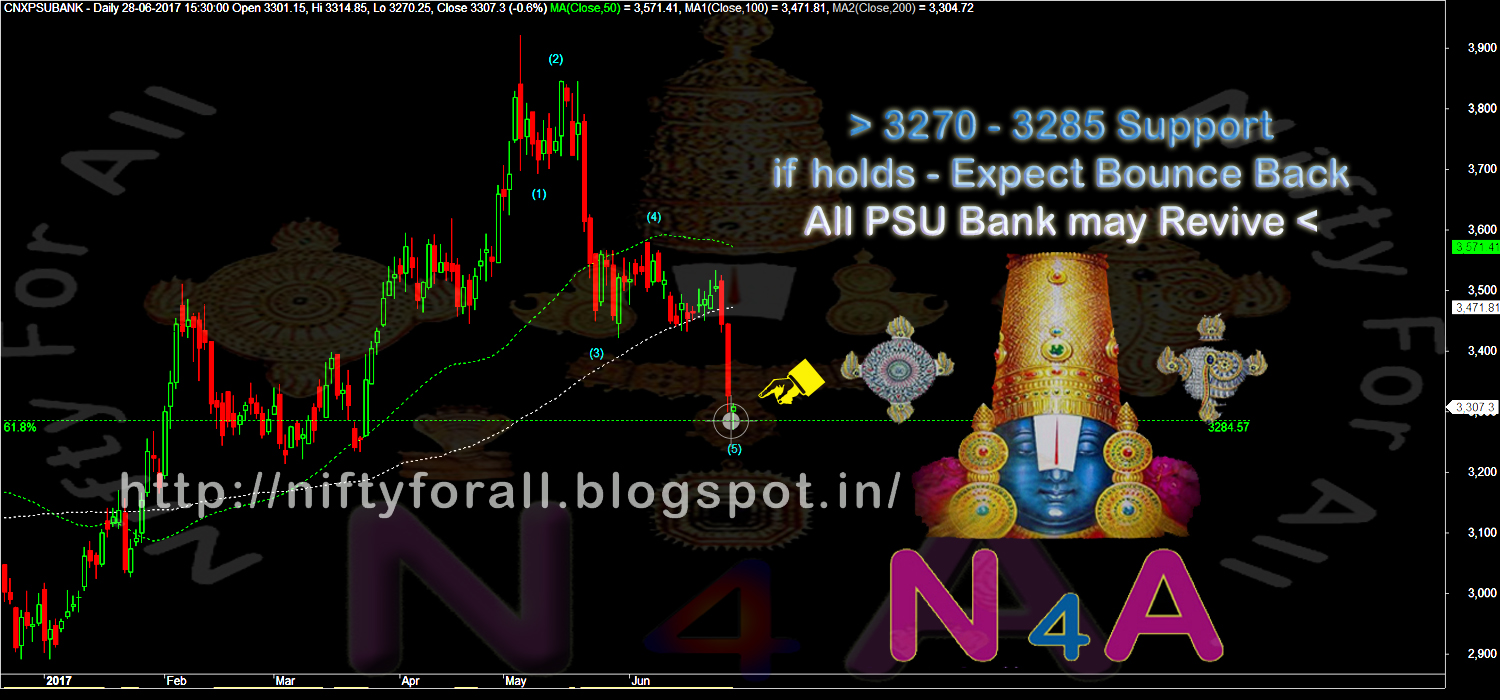
>>> CNXPSUBank_Daily_Chart - Posted on 28th June, 2017 <<<

>>> Click the chart to see on full screen <<<

Posted on 28th June, for a Possible bounce back any time.

>>> CNXPSUBank_Daily_Chart - More Rally Possible <<<

>>> Click the chart to see on full screen <<<

Resistance @ 3410 & 3420. Cross above may trigger another 100 points. All PSU Banks may also Rally. Cheers!!!

Wednesday, July 05, 2017

Above 9650 - Next Resistance @ 9690-9700

Dear All,

>>> Nifty Hourly Chart <<<

>>> click the chart to see on full screen <<<

Price need to break above 9650 to get resistance @ 9690 - 9700.

>>> LUPIN Daily - We are Long <<<

>>> click the chart to see on full screen <<<

Above the top channel - More Rally and short covering. We are long. Cheers!!!

Monday, July 03, 2017

Resistance @ 9620 & 9650. Support @ 9585 - 9560 & 9540

Dear All,

>>> Nifty Daily Chart - Posted on Weekly Review <<<


>>> Click the chart to see on full screen <<<


Wrote on Weekly Review - Price got support from 50DMA and Channel.

>>> Nifty Daily Chart - Happened <<<

>>> Click the chart to see on full screen <<<

Price rallied today as expect, may continue on the upward.

>>> IRB - Hourly Chart - We are Holding Long <<<


>>> Click the chart to see on full screen <<<


We are Long. Price completed 1-5 correction, may rally further above the trend line as shown on chart. Cheers!!!

Sunday, July 02, 2017

Weekly Review - 03rd July, 2017

Dear All,


GST comes into effect: The historic tax reform GST got implemented at 12 am on Saturday, eliminating multitude of taxes and levies and making one market for all the states and union territories across India. Under the regime, the government has fixed five tax rate slabs, viz 0 per cent, 5 per cent, 12 per cent, 18 per cent and 28 per cent for over 1,200 items.

Although, the move has been welcomed by India Inc and Dalal Street experts with open arms, it would be crucial to watch how it shapes up in the coming days.

Macroeconomic numbers:- The manufacturing sector data for June will be released on Monday. The manufacturing sector growth in the country moderated to a three-month low in May amid softer rise in new orders and production. The Nikkei Markit India Manufacturing Purchasing Managers' Index (PMI) -- an indicator of manufacturing activity -- declined from 52.5 in April to a three-month low of 51.6 in May, said a PTI report.

Key economic indicators, Nikkei Services PMI and factory output growth are expected to release this week. Markit Economics will unveil the result of a monthly survey on the performance of India's services sector in June 2017 on Wednesday, 5 July 2017. The Nikkei Services PMI in India rose to 52.2 in May 2017 from 50.2 in April 2017.

Global factors:- A host of macroeconomic data is slated to release next week.

Germany Manufacturing Purchasing Managers Index (PMI) data and UK Manufacturing PMI data for June will be unveiled on Monday. This apart, the US ISM Manufacturing PMI data for June 2017 will also be unveiled on the same day while the US ISM non-manufacturing PMI data for June 2017 will be unveiled on Thursday, 6 July 2017.

The US nonfarm payrolls data for June 2017 will be unveiled on Friday (July 7). The US unemployment rate data for June 2017 will also be unveiled on Friday.

Monsoon:- The India Meteorological Department (IMD) in its weekly weather report on Thursday said during the week from June 22 to June 28, all India actual rainfall stood at 48.6 mm as against normal rainfall of 51.1 mm, with a departure of minus 5 per cent. The all India cumulative seasonal rainfall from June 1 to June 28 stood at 147.8 mm as against normal rainfall of 148 mm, with a departure of 0 per cent.


>>> Nifty Weekly Chart <<<

>>> Click the chart to see on full screen <<<

For the Third time in a Week, Weekly Price failed to cross above 9660-70.

>>> Nifty Dialy Chart <<<

>>> Click the chart to see on full screen <<<

Price was supported by 50 DMA - Channel - 9450.

>>> Nifty Hourly Chart <<<

>>> Click the chart to see on full screen <<<

Its an Expanding Triangle - If channel support holds - Expect a Kick-back Rally.

>>> BankNifty-Daily-Posted on Last Weekly Review <<<

>>> Click the chart to see on full screen <<<

Wrote on Last Weekly Review - Bank Nifty on a Wedge like pattern - If breaks may fall.

>>> BankNifty-Daily-Chart-Happened<<<

>>> Click the chart to see on full screen <<<

Below 23000 - Price may correct another 500 Points

>>> Bank-Nifty-Hourly-Chart<<<

>>> Click the chart to see on full screen <<<

If not wrong - 23000 Support might be for wave 4. Expect a recovery if the support holds.

>>> CNXPSUBANK-Daily-Posted on 28th June, 2017 <<<

>>> Click the chart to see on full screen <<<

Posted on 28th June, 3285 Need to Hold.

>>> CNXPSUBank-Daily-Chart <<<

>>> Click the chart to see on full screen <<<

Still Holding 3285.

>>> PNB - Holding <<<

>>> Click the chart to see on full screen <<<

Holding PNB.

>>> Performance for the month end of June 2017 <<<

>>> Click the above image to see on full screen <<<

Above performance is not a Promise or guarantee for the given Profits or Loss.Performance given based on 1 lot at a time and clients Profit differ as per the margin availability and Number of Lots taken by them. We may or may not re-enter the Calls given here hit Stop Loss, as per market movement. The charts given above are just for educational purpose only and we don't recommend any Entry / Buy or Exit / Sell. Reader must taken their own decision or consult their qualified Analyst before making any decision

Thursday, June 29, 2017

Support @ 9470 & Resistance @ 9560 - 9590 - 9620

Dear All,

>>> Nifty Hourly Chart <<<


>>> Click the chart to see on full screen <<<


Price must hold 9470 for upmove. Key Resistance @ 9560 - 9590 - 9620.

>>> PNB - Daily Chart - We are Long <<<


>>> Click the chart to see on full screen <<<


We are Long in PNB. Price if Holds the channel support - Expect a Good Rally + Short Covering. Cheers!!!