Pages

Thursday, July 16, 2015

Next Resistance @ 8690

Dear All,

>>> Nifty Daily Chart <<<

>>> Click the chart to see on full screen <<<

Price crossed 8558 or 8561. Next Resistance at 8690.

>>> HINDUNILVR <<<

>>> Click the chart to see on full screen <<<

We have exited Short on HLL above 933. Short advised from 912 and earlier we made some part profit at 890. Still now looks like the fall can resume if the previous high is not crossed. Lets wait and see. Cheers!!!

Wednesday, July 15, 2015

Cat on a Wall

Dear All,

>>> Nifty 5 Mins Chart <<<

>>> Click the chart to see on full screen <<<

This chart was send today on whatsup during trading hours. Today Price closed above 78.6% or 8508. Tomorrow if price able to trade above 8561 - rally to continue.

>>> Bank Nifty Hourly Chart <<<

>>> Click the chart to see on full screen <<<

Hope the above picture says the story. Key resistance 18940 must cross for a good rally. Else price may test the two supports as shown on chart.


Tuesday, July 14, 2015

Resisted @ 8467. Caution Advised

Dear All,

>>> Nifty Hourly Chart <<<

>>> Click the chart to see on full screen <<<

As wrote Yesterday - Nifty unable to cross above 8467-68, got resisted. If not tomorrow also, Fall may resume.

>>> Bank Nifty Hourly Chart - Posted on Weekly Review <<<

>>> Click the chart to see on full screen <<<

Above Chart - Posted on Weekly Review - See what happened.

>>> Bank Nifty Hourly - Happened <<<

>>> Click the chart to see on full screen <<<

After filling the gap - Price moved up a bit. But unable to cross the pitchfork - Stay Caution.

Monday, July 13, 2015

Resistance @ 8467 & 8508

Dear All,

>>> Nifty Hourly Chart <<<

>>> Click the chart to see on full screen <<<

Greek Deal helped the bulls to fill the gap left on the upper side. Two resistance 8467 or 8508 must be crossed for more rally.

>>> HINDUNILVR - Follow Up <<<

>>> Click the chart to see on full screen <<<

Its a follow up - for our earlier call. Price may resist as shown on chart. Fall may resume any time - if the price unable to cross the given levels.

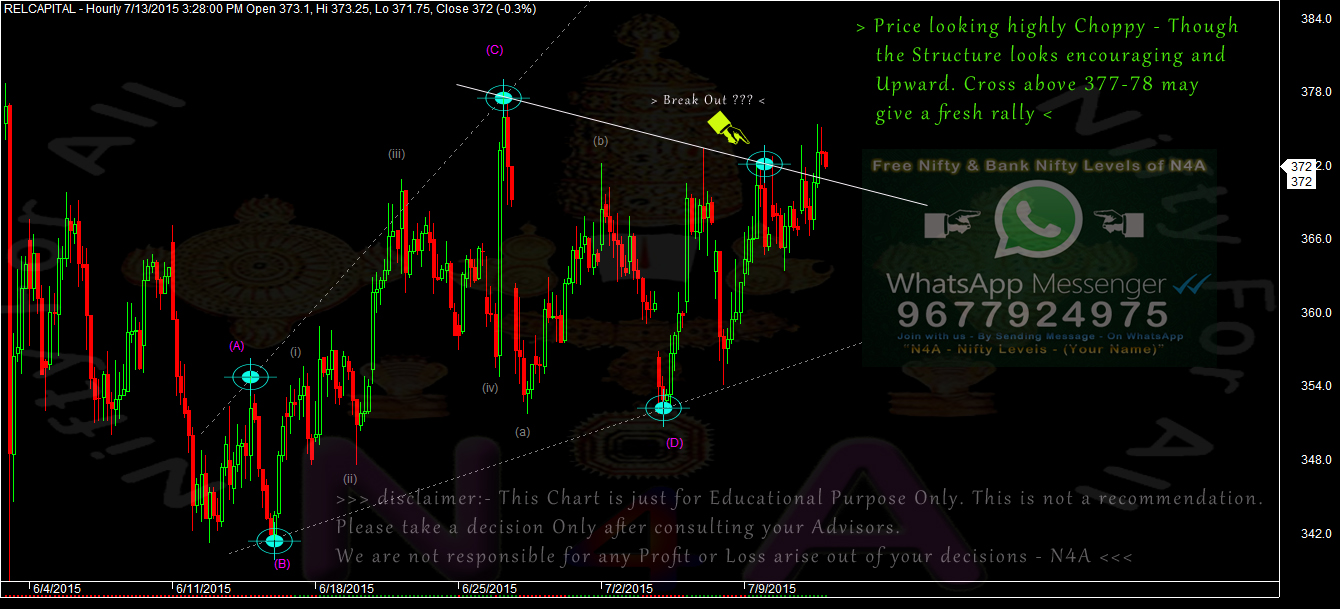
>>> RELCAPITAL <<<

>>> Click the chart to see on full screen <<<

Above 377-78 - Price may rally. Lets See. Cheers!!!

Saturday, July 11, 2015

Weekly Review - 13.07.2015

Dear All,

>>> Nifty Weekly Chart <<<

>>> click the chart to see on full screen <<<

Its a Spinning Top Candle Stick. Price almost Touched 50WMA. May be its a reversal Sign. If trades below 50WMA - Bear may take Advantage. Caution Advised.

>>> Nifty Daily Chart <<<

>>> click the chart to see on full screen <<<

Wave X completed as ABC - which was resisted @ 50% retrace near 8558 or 8561. Hence the count and pattern shows unhealthy for bulls. It looks like a Sell on rise.

>>> Nifty Hourly Chart <<<

>>> click the chart to see on full screen <<<

Its a clear support at 8320 after completing a 1-5 rally till 8561. Below 8320 - Price may see 8190-85 level.

>>> Bank Nifty Daily Chart <<<

>>> click the chart to see on full screen <<<

Like Nifty Bank Nifty also completed Wave X as abcde. Until channel holds the price below, Price may remain under pressure form Bears. Cross above the channel may favour Bulls.

>>> Bank Nifty Hourly Chart <<<

>>> click the chart to see on full screen <<<

Price retraced on friday may get resisted on the lower trend line of the pitchfork. Almost the Gap also filled. Unable to cross above Friday high may trigger sell off.

>>> HINDUNILVR - Posted on 09th July, 2015 <<<

>>> click the chart to see on full screen <<<

Wrote - Price may correct move if stays below the wedge. See what happened.

>>> HINDUNILVR - Happened <<<

>>> click the chart to see on full screen <<<

As expected - Price started falling below the wedge. More such fall expected. Cheers!!!

Thursday, July 09, 2015

Support @ 8320 & 8250

Dear All,

>>> Nifty Hourly Chart <<<

>>> Click the chart to see on full screen <<<

As wrote Yesterday On Hourly Chart - Price touched near 8320. If breaks may test 8250. Else expect some relief rally.

>>> APOLLO HOSPITAL <<<

>>> Click the chart to see on full screen <<<

ABC completed inside the channel as shown on chart. Expect more fall if the channel breaks as shown on chart.

>>> HINDUNILVR <<<

>>> Click the chart to see on full screen <<<

Broken wedge. If price stays below the trend line - expect more fall. Cheers!!!

Wednesday, July 08, 2015

Game Over ????

Dear All,

>>> Nifty Daily Chart <<<

>>> Click the chart to see on full screen <<<
If this Pattern and Count are not Wrong - Worst is Yet to Start.

>>> Nifty Hourly - Posted on Whatsup Today <<<

>>> Click the chart to see on full screen <<<
Chart posted on Whatsup today afternoon. 8320-25 not broken still. Lets wait and see. Cheers!!!

Tuesday, July 07, 2015

Major Hurdle @ 8670-80

Dear All,

>>> Nifty Hourly Chart - Posted on Weekly Review <<<

>>> Click the chart to see on full screen <<<

Posted on Last Friday - was a road map for next move. See what happened.

>>> Nifty 15 Mins Chart <<<

>>> Click the chart to see on full screen <<<

Resistance at 8670-80. Lets Wait and See. Cheers!!!

Monday, July 06, 2015

Resistance @ 8575 & 8680.

Dear All,

Today we are discussion a Two Alternatives on Nifty Hourly Chart. As per our previous updates - After Nifty Crossed above 8430 - Pattern and counts also changed. So as far as the current trend - still we have some more rally left. Since I feel that the rally is for Wave (X) or as Wave (b) - Stocks are not going to perform - and no doubt - You can witness a good volatile and choppiness also.

Today when all the world markets are bleeding - Our Index able to close on a positive zone. If you want to know why ??? Here is the reason given below as chart. Both the Alternative are singing a Bearish Tone Only. Lets See how it works.

>>> Nifty Hourly Chart - First Alternative <<<

>>> Click the chart to see on full screen <<<

First Alternative - Counted as ABC for Wave X. In such a case - Price on the last leg of Wave C.

>>> Nifty Hourly Chart - Second Alternative <<<

>>> Click the chart to see on full screen <<<

Second Alternative - Price moving up for Wave B. In such a case - Price on the last leg of Wave B.

Both the scenario looks for a Bearish move, almost near the last leg of upmove. Above charts don't recommend any short now, as the rally may extend a bit more. Cheers!!!

Sunday, July 05, 2015

Weekly Review 06.07.2015

Dear All,

>>> Nifty Daily Chart <<<

>>> Click the chart to see on full screen <<<

Yes, its a firm stand by Nifty. Above Channel + 100 Day Moving Average and 8430. Next 8566.

>>> Nifty Hourly Chart <<<

>>> Click the chart to see on full screen <<<

Above 8490-95 - Rally may continue till 8680.

>>> Bank Hourly Chart <<<

>>> Click the chart to see on full screen <<<

Bank Nifty near channel Resistance - Break above may move further up.

>>> XXX XXX <<<

>>> Click the chart to see on full screen <<<

Above stock is facing a crucial resistance on channel. Unable to cross may trigger more sell off.

>>> Performance for the month end of June, 2015 <<<

>>> Click the image to see on full screen <<<

Kindly send email to niftyforall@yahoo.com for details of our service.

Thursday, July 02, 2015

A CAT on the WALL ..!!!

Dear All,

>>> Nifty Hourly Chart <<<

>>> Click the chart to see on full screen <<<

8495 Key Resistance - Cross above can rally till 8680. RSI looks dangerous. So the CAT may jump any where any time. Caution.

>>> Bank Nifty Hourly Chart <<<

>>> Click the chart to see on full screen <<<

18666 - May give a tuff resistance for bulls. Cross above may see more rally. Else Fall. Caution.

>>> BPCL - Daily <<<

>>> Click the chart to see on full screen <<<

Last 4 days - some of our friends requested for BPCL Outlook. So presenting here the view for the Stock. Looks like RSI and Price are on a break out still. So next Resistance are at 907,924 and 945 Cheers!!!

Wednesday, July 01, 2015

Above 8425 - More Rally Possible. Caution Advised at Higher Level

Dear All,

>>> Nifty Hourly Chart <<<

>>> Click the chart to see on full screen <<<

Nifty breaks above 8425. Now the Price moving as 1-5 and we are on the last 5th wave. Key Resistance as shown on above chart. Caution advised at higher level.

>>> LT Hourly Chart <<<

>>> Click the chart to see on full screen <<<

LT on the last leg of upmove. 1820 or channel may act as a resistance for bulls. Caution advised at higher level.

>>> HINDUNILVR <<<

>>> Click the chart to see on full screen <<<

Stock on a move for Wave X as 1-5 as shown on chart. Caution advised at higher level. Key resistance @ 832 and 950. Cheers!!!

Tuesday, June 30, 2015

Gap Filled - Now Resistance @ 8378 & 8423

Dear All,

>>> Nifty Hourly Chart <<<

>>> Click the chart to see on full screen <<<

The current rally may be for wave (b) - today filled the gap left between 8330 and 8378. Today high was exactly 8378. Tomorrow 8378 and 8423 may act as a key resistance. RSI looking for a break out, if happens price may rally. Lets See.

>>> LT Hourly Chart <<<

>>> Click the chart to see on full screen <<<

Had a second short entry in LT. RSI still on Bear side. Channel may act as a resistance. Lets See. Cheers!!!

Monday, June 29, 2015

Key Resistance 8330

Dear All,

>>> Nifty Hourly - Posted on Weekly Review <<<

>>> Click the chart to see on full screen <<<

Posted the above chart on weekly review - Said the importance of the Channel and RSI. See what happened.

>>> Nifty Hourly - Happened <<<

>>> Click the chart to see on full screen <<<

Market Opened up with a big gap down and We booked almost a 200 Points Profit today.
Above chart shows the Gap has filled and the Resistance line must be crossed for any upmove. Else fall may continue.

>>> LT - Posted on Weekly Review <<<

>>> Click the chart to see on full screen <<<

We wrote to sell LT. See what happened !!!

>>> LT - Happened <<<

>>> Click the chart to see on full screen <<<

As Expected Price Fell on the opening Bell. We Booked on the First Target with a Profit of Rs.6875/-

>>> Biocon - Posted on Weekly Review <<<

>>> Click the chart to see on full screen <<<

Wrote about trend line support for Biocon. See what happened.

>>> BIOCON - Happened <<<

>>> Click the chart to see on full screen <<<

As expected Price broken the trend line. We booked Rs.10,000 Profit. Cheers!!!

Saturday, June 27, 2015

Weekly Review - 29.06.2015

Dear All,

>>> Nifty Weekly Chart <<<

>>> Click the chart to see on full screen <<<

Its a clear break out from RSI - But still price need to confirm the same for a clear rally. Price above 50 Week Moving Average may also help the bulls.

>>> Nifty Daily Chart <<<

>>> Click the chart to see on full screen <<<

Explanation on chart. To make it simple - Trend line to decide the trend.

>>> Nifty Hourly Chart <<<

>>> Click the chart to see on full screen <<<

Hourly Chart giving us a different view. RSI - for the last 4 days moving negatively while price stays below the upper channel. If price cross above the channel may trigger a Short covering and Fresh Buying. Else if RSI break the trend line as shown on chart - Sell off may start.

>>> Bank Nifty Weekly <<<

>>> Click the chart to see on full screen <<<

Need more confirmation from Price and RSI for Next move.

>>> Bank Nifty Daily <<<

>>> Click the chart to see on full screen <<<

Key Resistance 17480 or Channel Top should cross for a good rally.

>>> BIOCON <<<

>>> Click the chart to see on full screen <<<

More fall expected on Biocon, if Price breaks the Trend line as shown on chart.

>>> LT <<<

>>> Click the chart to see on full screen <<<

Caution Advised on LT - Cross above the Channel Resistance may see Rally.

>>> Performance till 26th June, 2015 <<<

Send us email to niftyforall@yahoo.com for details about our Service. Cheers!!!