Pages

Wednesday, October 31, 2012

Just a Relief Rally ?

Dear All,

>> NIFTY <<


>click the chart to see on full screen<


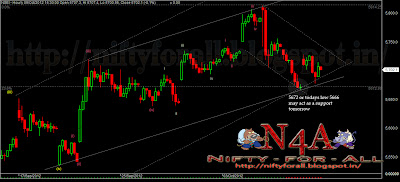
Nifty paused the day today with a relief rally. 5636-41 should be the stiff Resistance as I think it wont get crossed. As I wrote earlier 5550 or 5530 should be the bottom line before next upmove.

>>BANK NIFTY<<

>click the chart to see on full screen<

Bank Nifty even though Broken today 11150 as I wrote yesterday, managed to move up as the channel of expanding triangle gave strength. Support at 11125 and 11250. Resistance 11330, 11390 and 11450 act as a Resistance.

Lets see. Cheers!!!

Tuesday, October 30, 2012

Finally Broken the Wall

Dear All,


>NIFTY<
>Click the Chart to see on full screen<

Finally Nifty broken the Support 5636, now should fall near 5550-40 to complete the C wave as given on chart.

>BANK NIFTY<

>Click the Chart to see on full screen<

Unlike I wrote Yesterday, Bank Nifty unable to hold 11420, and fell down to a low of 11173. Tomorrow 11150 act as a support and if hold we may see a reasonable rally as the pattern looks like a expanding triangle.

Failed to hold the support may see a good sell off as there are lot of gaps left on the bottom to be get filled.

Lets see.

Monday, October 29, 2012

Bank Nifty - Monetary Policy Special

Dear All,

As lot of news started roaming around the Channels about Monetary Policy, followed by RBI's GDP forecast from 6.5% to 5.7%, many started taking about a big gap down opening tomorrow. So it becomes necessary for me to find out whats happening in Bank Nifty too.

>Click the Chart to see in full screen<

Above Bank Nifty Chart - it seems like its still on B Wave, as I feel its like a Raising Wedge in a a-b-c-d-e. I feel like one more raise is pending till 11740 that it may make a double top or even go above it before a good fall.

I may be wrong, if Bank Nifty opens in a gap down. But if breaks below 11420 then only a Fall is confirmed. Else any time Bank Nifty may shoot up.

Lets see. Cheers!!!

Nifty - Still Kept Guessing

Dear All,

Nifty kept every one guessing, gone no where stayed inside the gates between 5720 and 5636. So the levels again getting importance as RBI set to announce its Monetary Policy tomorrow.

RBI continuously fought inflation with 13 successive rate hikes till October 2011, the last rate hike was exactly a year ago, while Govt trying to reduce its fiscal deficit by increasing diesel,Petrol and Gas prices.

While Fuel price hike has spurted Inflation to 7.81% in September, its getting more important to look after the Monetary Policy tomorrow. Almost all Banks are struggling for Funds and crying to RBI to cut Rates, due to slowdown in their Loan growth and increasing Bad Assets, High voltage of pressure mounts on RBI to cut rates.

So what MR. Subbao Rao going to do tomorrow, shall decide the trend in forth coming days.


>Click the Chart to see on full screen<


Many more alternative counts has been given on last 3 weeks, as Nifty kept us guess like these. Here is one more. B wave has been ended with a-b-c-d-e as a triagle,and C wave started as shown on chart.

But again 5636 or 5720 should give us a clear trend. Lets see.

Saturday, October 27, 2012

Weekly Review - 29.10.2012

Dear All,

After 2 weeks of consolidation, Nifty unable to break 5636 on the lower side and 5720 on the upper side. Made a side ways movement with a high voltage volatile. Its sure that both side stop loss hit for most of the traders.

Also on daily basis 5630 is very important as i have mentioned in my last weekly review, So new readers can refer previous weekly review for the same.

Here on Hourly chart there are 2 Possibilities on Nifty.

>>> NIFTY - Possibility - 1 <<<

>Click the chart to see on full screen<


Above Half an Hour Chart - shows that we are still in B wave. This move is valid only if it does not breaks 5636, hence it may go up till 5720 or 5745 to end wave B before next fall.

>>> NIFTY - Possibility - 2 <<<

>Click the chart to see on full screen<


Next Possibility is that Nifty has completed Wave B. A Possible triangle break down and a good sell off on friday has confirmed that. Also need to break 5636 next week for next fall. If not broken, then it can go up as said on first case.


>>>Follow Up - JP Associates<<<

Last week on Weekly Review, I have given JP Associates as a Buy candidate as it gave a break out on daily chart. But on Wednesday Update - wrote, Interim Upmove has ended, and gave chart as below
>Anticipated<

>Click the chart to see on full screen<


>Happened<

>Click the chart to see on full screen<


As anticipated JP Associates made a good fall from 94.50 to 90.

(23/Oct/2012 12:48:16): Sell JPASSOCIATES below 94.50. SL above 96.40 (closing). Target 92 and 90 (all spot lvl)

(26/Oct/2012 14:00:06): JP ASSOCIATE near Second Target 90. Sell given at 94.5. Shall Book Full Profit at 90 for a Profit of 4000 X 4.5 = Rs.18000/- Hope all enjoyed.

>>>BAJAJ AUTO<<<

>Click the chart to see on full screen<


Bajaj Auto - As shown on chart, can short with a Stop Loss of 1820 for a good fall next week.

>>>PERFORMANCE<<<

>Click the Image to see on full screen<


Performance till 26th Octo, 2012. Interested shall contact me on krish_venkatesh@yahoo.com or 9677924975.

Wednesday, October 24, 2012

Nifty - Still Cat on the Wall ???

Dear All,

>Click the chart to see on full screen<

Still Cat is on the Wall.?!?!?. 5670-76 if breaks on the lower side of the channel may see a fall. As usual 5720 remains as a Resistance on the Upper side. 5710 now becomes a upper trend line resistance. So lets wait and see what happens tomorrow.

>>>>AUROPHARMA<<<<

>Click the chart to see on full screen<

Auro Pharma ready to fall. If i am not wrong, stock has completed A and B Wave and ready for a C wave fall. A Probable double Top made at 162.90 confirmed B wave has ended. Lets See.

>>>JP ASSOCIATES<<<
>Click the chart to see on full screen<

Jp Associates - Came out of the the Symmetrical Triangle. It seems the Stock has halted its temporary uptrend. Get ready to see the stock falling. Sell and Enjoy.

Cheers!!!


Monday, October 22, 2012

Nifty - Up or Down ???

Dear Sir,

>Click the chart to see on full screen<

Once again Nifty tested 5720 and closed near it. But this time a possible cross over above 5720 as it seems wave B is on the formation. 5746 and 5770 shall be the possible upper side target.

Saturday, October 20, 2012

Weekly Review - 22.10.2012

Dear All,

Its a Black Friday for US Markets after a dis-appointed earning from heavy weights particularly from Tech sector. Nasdaq alone down 67 Points of 2.18%. Since Nifty is on a crucial Point, its very much important for us to see how we Open on Monday. So lets see how Nifty is now..

>Click the chart to see on full screen<


Nifty Daily chart suggest 5630 is a Strong Support. Due to weak global cues - it seems Nifty may breach this level on Monday. If breaks then there is a High chance of filling the Gap left on bottom at 5447.

>>>CIPLA<<<

>Click the chart to see on full screen<


Cipla already given on weekly report earlier.Every time Cipla is breaking the Channel Line as market on chart and falling down shows that the stock is in a full time Bear Grip. Now as per chart it seems CIPLA has broken down a 35 Points Triangle. Seems like Fall should be fast and furious. Lets wait and see.

>>>>PERFORMANCE<<<

>Click the image to see on full screen<


Above sheet is the Performance for the Period upto 19th, October, 2012.

Thursday, October 18, 2012

Nifty - On the Line of Fire ?!?!?

Dear All,

>Click the chart to see in full screen<

Again Nifty trying to Break 5720, and closed at 5716. There is no meaning in changing the counts and view often - as the movement became very volatile in nature.

To say it simple Nifty should either break 5640 or 5720 and must trade below or above the mentioned levels for the next move. Else its like a range bound or like a trapped bull and bear.

So if trades above 5720 tomorrow, then next Target should be 5745 and 5775 as show on chart.

Lets wait for Friday move to decide. Cheers

Wednesday, October 17, 2012

Nifty - Testing the Patience.

Dear All,

>>Click the chart to see on full screen<<

Nifty still not able to break the Neck Line or 5636-5640. Also not crossing 5720 on the Upper Side. Totally Nifty looks Dead and Testing lot of Patience for the last 5 Trading sessions.

Lets wait for Price confirmation.

>>CROMPTON GREAVES<<


>>Click the chart to see on full screen<<

16/Oct/2012 09:18:32): ***N4A-STOCK-ALERT**** Sell CROMPTON GREAVES below 136 SL above 142 (closing Basis). Target 132 and 126 (all spot lvl)

(17/Oct/2012 12:12:32): ***N4A-STOCK-UPDATE**** Crompton Greave near Second Target 126. Profit so far 2000 X 10 = Rs.20000/-. Enjoy

Lets wait for More Profitable Trade..Cheers!!!

Tuesday, October 16, 2012

Nifty - Its a Bear Warning !!!

Dear All,

>>Click the Chart to see on full Screen<

Nifty Broken down once below 5640 and gave a Bear Warning !!!.

Now it seems B got completed and C wave 1-5 wave downside started.

> Alternative Count <


>>Click the Chart to see on full Screen<

An alternative count is necessary here as there was a Triangle formation also. As per this A cut shorted as a-b-c and B has formed a triangle formation as a-b-c-d-e as shown on the above chart.

As per this 5660 and 5640 are the support levels - and both level breached today - shows one more Bear Warning.

As per 5550 or 5570 shall be the possible target on the downside. Lets See!!!


>>>HINDALCO<<<

>>Click the Chart to see on full Screen<

One more Head and Shoulder Pattern - its on Hindalco. I think no explanation needed for the above chart. We too had a sell position in Hindalco. Lets see.

>>IFCI<<

>>Click the Chart to see on full Screen<

I have discussed several times about IFCI in this Blog. Many Queries has been answered. Once again IFCI gave Triangle break down and a Sell signal today. Expecting a fall tomorrow or in coming days. Lets See.

Monday, October 15, 2012

Nifty - A Cat on a Wall !!!

Dear All,

>Click the Chart to see on Full Screen<

Nifty stuck between 5690 and 5650 - gave a Choppy trade today.

A break on either side should give a clear trend. Break above may give 5750 for Wave B

A break below 5640 should ensure the completion of Wave B and start of Wave C. A Clear Head and Shoulder Pattern emerges below 5640 - followed by selling pressure.

Those who still have confusion refer my Friday Weekly Review for more clarity.

Saturday, October 13, 2012

Weekly Review - 15.10.2012

Dear All,

My Last Post on this Blog about Head and Shoulder on Nifty - almost coming in to reality when Nifty was slowly loosing its strength on Friday.

Now the Big question is will Nifty break 5638-40 - base support or Neck Line. Here are the two possibilities.


>> NIFTY << >> Possibility - 1<<

>Click the Chart to see on full Screen<<


Nifty has completed Sub wave B and should fall below the base line support 5638-40. Target should be 5550 or 5500.

>>NIFTY<< >> Possibility - 2<<

>Click the Chart to see on full Screen<<


Nifty yet to complete sub wave B. In that case nifty may take support 5660 or 5640 and may bounce upto 5750 before a fall for completing wave B. So Nifty may fall upto 5570 or 5520 for wave C.
>>INFY<<


Expected 2 weeks before as given Weekly Review - 30th Sep,2012 :-

>Click the Chart to see on full Screen<<


Have advised my clients to go short on INFY at 2600 for a Target of 2440 and 2300.

Happened on Friday during Result Day as below.

>Click the Chart to see on full Screen<<


Booked all Profits from 2600 to 2300. Lot Size 125. Refer Performance sheet for Details.

>> JP ASSOCIATES <<

>Click the Chart to see on full Screen<<


Technically JP Associates has broken its Two and Half Year Trend line and gave a clear Bullish signal.

Not only JP Associates, but all cement companies started moving up..So what the News behind it.

On June 21, CCI had slapped Rs 6,307 crore penalty on 11 cement makers.The order was passed following probe by its Director General (Investigation) on a complaint filed by Builders Association, which has hailed the order saying "it was long-pending and the penalty could have been higher"

CCI had not disclosed various facts about matters like production, dispatches and pricing.

Meanwhile Competition Appellate Tribunal (COMPAT) has asked on 11th Oct, fair trade regulator CCI to give fresh copies of its order levying over Rs 6,300 crore in penalties on 11 cement companies for cartelisation, providing them with complete details on production, pricing and sales.

The tribunal said the matter would be listed for further hearing within seven weeks, taking into account the fresh details from the CCI and the cement companies.

This was an Interim Relief to all 11 Cement Companies including JP Associates.

>>PERFORMANCE<<

>Click the Image to see on full Screen<<

Performance upto 15th Oct, 2012. All Levels are given on Spot Only. Stop Loss on Closing Basis Only. Interested may contact krish_venkatesh@yahoo.com or 96779247975.

Thursday, October 11, 2012

Nifty - Possible Head & Shoulder ???

Dear All,

>>> Click the Chart to see on full Screen <<<

As told Yesterday 5640 gave a Good Support and Nifty was able to rally nicely. Now it seems Nifty trying to form a Head and Shoulder like Pattern as shown on chart.

I hope the On going upmove was a corrective in nature for wave B and if able to cross 5728 then may move up to 5746 and 5776 Resistance which are 61.8% and 78.6% retrace of Wave A.

Since tomorrow is a Result Day for INFY Q2 and IIP Data - More action waiting.

Every one is waiting for Infosys EPS F13 Guidance, as Rupee is appreciating sharply.

>>> TATA STEEL <<<

>>> Click the Chart to see on full Screen <<<

If you are my regular blog reader - then You must remember about Tata Steel Chart I have posed a few days before, that it has created a Inverted Head and Shoulder. Since 61.8% retrace is at 414.2, today it crossed its important previous high of 418 and gave a clear break out.

Now the Stock should move toward 432 and more in coming days.

Cheers!!!

Wednesday, October 10, 2012

Nifty - Last Support 5640

Dear All,


>Click the chart to see on full screen<


Nifty on last Suppport 5640, if breaks then 5560 on Card. As said earlier if 5540 also broken then fall upto 5440 to 5430 not ruled out.

As I have alerted on my weekly review with Bearish Candle on Daily Chart, one should have profited from this fall. Now its time to Protect your profit with Proper Stop loss as the give support above holds the market.

>>>HINDALCO<<<


>click the chart to see on full screen<

As per the above chart, it seems 116 is a good Support. We had a Sell call earlier Last week - and target achieved today.

(05/Oct/2012 10:29:54): ****N4A-STOCK-ALERT****
Sell HINDALCO near 125-126. SL above 128. Target 122 & 116. (all spot levels)

Today achieved all Targets. Profit 2000 X 10 = Rs.20,000/-

Lets see. Cheers!!!

Tuesday, October 09, 2012

Nifty - On First Support Zone!!!

Dear All,

>Click the chart to see on full screen<

Nifty near its First Support zone. 5672 which is 23.6% retrace of the current up move. 5666 - which is todays low is also very important for tomorrow. Breaks below these 2 levels may push nifty to the next lower level target. Please refer Last friday and Monday Posts for targets.

Cheers!!!

Monday, October 08, 2012

Nifty - Here comes the Bear ?!?!?

Dear All,

>Click the Chart to see on full screen<

If you might have read my Weekly Review - You should not surprised by the Sell off today. So as expected the Bear returns. Tomorrow 5640 act as a support. If breaks then only a fall up to 5560 comes in. If Breaks 5540 then a fall upto 5430 cant be ruled out in coming days.

>>TATA MOTORS<<

>Click the Chart to see on full screen<

Tata Motor - Following every week, now its time to short. As I gave a short call to my client

(08/Oct/2012 10:07:18): ****N4A-STOCK-ALERT****Sell N Hold TATA MOTORS below 278. SL above 284. Target 272,2xx and 2xx (all spot level)

(08/Oct/2012 13:52:26): ****N4A-STOCK-UPDATE**** TATA MOTOR: CMP:273. SELL GIVEN AT 278. PROFIT SO FAR 1000 X 5 = RS.5000. SMALL TRADERS BOOK PROFIT. OTHER SL CTC

Expecting more fall in coming days...Let see.

Saturday, October 06, 2012

Weekly Review - 08.10.2012

Dear All,

>>> NIFTY <<<< Hourly Chart


>> Click the Chart to see on full screen <<


Hourly chart EW counts suggest that the Last 5 waves with Extension has been finished. On Friday Price broken the so far upmove channel and now if the Interim channel in yellow color gets broken, then a clear sign of bearish emerges with good sell off on card.

Eod Chart

>> Click the Chart to see on full screen <<


A Bearish Engulfing Candle on Daily Chart Suggest a Strong reason to believe the Uptrend may be reversed. I suspect a heavy sell off next week.

Weekly Follow Up:-

>>> IFCI <<<

>> Click the Chart to see on full screen <<


Chart I gave last week. Below chart is Happened this week

>> Click the Chart to see on full screen <<

As expected IFCI started its down move, My first target also hit. I suggest caution for those who hold this stock as I expect more downside in coming days.

Weekly Chart >>> TATA STEEL <<<


Seems like a IHS - But continuously Resisting at 61.8% raises concern. Need a clear signal - a break out above 417 with volume may trigger in Bulls side.

But the EW count suggest caution as there can be some cool off happen before an upmove.

Lets see. Cheers!!!

Thursday, October 04, 2012

Nifty - Is Bear Dead or Alive ???

Dear All,

>>> NIFTY <<<


>Click the chart to see on full screen<


Nifty retraced almost 61.8% of wave (iii) - seems that this can act as an Strong Resistance. Cross above this level may test 5878 which is 78.6% of retrace level. Lot of news like FDI in Insurance etc., huge Buying spree from FII's driving the market higher with Extension waves in Nifty. No doubt all are in doubt and Nifty short holders are in Panic.

Nifty shall correct only when the Channel Line gets broken as shown on chart.

I have received many queries about "What's my view on Nifty". As I wrote Yesterday - every one should understand that its hard to trade on Extension Waves. Lot of Negative Divergence can't stop Nifty. So One should wait till a strong signal emerges.

Todays Performance:-

(04/Oct/2012 09:18:22): ****N4A-STOCK-ALERT*** :- Sell CIPLA below 378. SL above 386. Target 368 & 356. (all spot levels)

(04/Oct/2012 15:24:03): ****N4A-STOCK-UDATE*** :- CIPLA 364. SELL GIVEN AT 378. PROFIT 1000 X 14 = RS.14000/-. BOOK AND ENJOY.

27/Sep/2012 10:10:02): *****N4A-STOCK-ALERT*****Sell N Hold IFCI between 31-31.30. SL above 31.90 (closing Basis). Target 29 & 27. (All spot Levels - Lot size:-8000)

(04/Oct/2012 15:15:01): IFCI hit 29. Profit 8000 x 2.30 = Rs. 18600 = Great Profit. Book and Enjoy

I have given IFCI Chart and Details for its weakness in my Last Weekly Review. Refer it.

Wednesday, October 03, 2012

Nifty - Is this Last Leg or Beginning ???

Dear All,

>Click the chart to see in full screen <

Usually its very difficult to trade on Extended Wave Pattern. Market usually move in a choppy and volatile manner. Right to say hard to trade and Stop Loss to hit on either side.

Thank god, we are able to make some reasonable profit, even though we had some stop loss also.

Here in Nifty it seems to be on Last leg of upmove, means an interim correction is set to go. As I mean to say that 3rd or C wave is set to complete and may correct.

It should be noted that even though there is a Negative Divergence on chart, there is no Valid Sell Signal, means possible of extension is also more which choppy trade in coming days too.

>>BANK NIFTY<<<

>Click the chart to see in full screen <

Bank Nifty consolidating inside a Box after completing 1-5 seems to be fishy, a break out on either side to decide the trend.

Lets See. Cheers!!!

Tuesday, October 02, 2012

Nifty Faces Resistance at 5726 & 5740

Dear All,


>Click the Chart to see on Full Screen<


Nifty facing a Resistance on 5726 & 5740. If breaks Support at 5690 then possible fall upto 5645 to fill the gap left.


Auto Sales - Golmaal


In both 2010-11 and 2011-12, the government appears to have been juggling export figures to paper over what looks more and more like an unexplained overinvoicing scam.

The story begins in October 2011, when three smart cookies at Kotak Securities smelt something fishy in the government’s export data for 2010-11. The three – Sanjeev Prasad, Sunita Baldawa and Amit Kumar – said: “Our study of exports data of major engineering companies (including automobiles and metals) shows that the increase in their exports does not reconcile with the steep increase in official exports data. In fact, the gap is quite substantial.”

According to them the official export data showed a 79 percent year-on-year export growth in 2010-11. Exports by engineering companies in the BSE 500 (the cream of India Inc) showed just 11 percent growth. In dollars, the engineering export jump accounts for $30 billion (up from $38 billion to $68 billion), while the figures for the BSE 500 showed a rise of just around $1.38 billion. (All approximate figures due to rupee-dollar conversion at fixed rates).

The government woke up in December 2011, and put it all down to a system crash in the commerce ministry and mistakes in data classification and data entry.

The then Commerce Secretary announced that exports in April-October 2011 had been overstated by $9.4 billion. The real goof-up was bigger, with engineering exports being overstated by $15 billion and a $12 billion underestimation in the case of petroleum and gems and jewellery exports, apart from other goofups.

Kotak also brings back the question of car exports. India, it seems, managed to export more cars for less in 2011-12: a six percent fall in earnings despite a 14 percent rise in the number of cars exported. This is, of course, possible if smaller cars are being exported (or discounted) as against larger ones before, but was that what happened?

According to the Kotak report, “exports of cars as per government data declined to Rs 18,200 crore in FY2012 from Rs 19,200 crore in FY2011 despite the number of exported cars as per Society of Indian Automobile Manufacturers (SIAM) rising to 5,07,318 from 4,44,326 in FY2011.”

The commerce ministry is tying itself up in knots over export data when there may be a simpler explanation at hand: overinvoicing by exporters in 2010-11. That would also mean some of the black money held abroad may have come back into India as export earnings – on partially fictitious exports.

Nothing less than an investigation by the Comptroller and Auditor General and the Central Bureau of Investigation will unravel the real truth behind these dubious numbers.


>>TATA MOTORS<<

Tata Motors reported 3.82 percent decline in its total vehicle sales to 75,773 units in September.

Tata Motors had sold 78,783 units in the same month last year, Tata Motors said in a statement. The total passenger vehicle sales in the domestic market stood at 21,652 units in September, down 17.73 percent from 26,319 units in the same month last year.

The company’s exports decreased by 12.48 percent to 5,441 units last month from 6,217 units in the same month last year


>Click the Chart to see on Full Screen<


A Bullish Flag Like Pattern emerges on 5 mins chart shown above. But it seems that EW counts looks bearish as it has completed an correction upmove wave B and started wave C on the downside. If breaks the Trend Line and Channel (flag) then Tata Motor may try to fill the gap left on the bottom of the Chart.

Also we have discussed earlier that Tata Motors is forming a H&S on Daily Chart. A Break below 250 shall confirm that.