>>> NIFTY Weekly Chart <<<

>>> Click the chart to see on full screen <<<
Above 11760 - May trigger more rally till 12000 - 12200.
>>> NIFTY Hourly Chart <<<

>>> Click the chart to see on full screen <<<
Resistance @ 11720 & 11760. We are Holding LONG.
>>> BANK Nifty Weekly Chart <<<

>>> Click the chart to see on full screen <<<
Possible Break out Weekly Chart - May Trigger more rally.
>>> Bank NIFTY Daily Chart <<<

>>> Click the chart to see on full screen <<<
Watch Resistance & Support.
>>> NIFTY IT - Daily Chart <<<

>>> Click the chart to see on full screen <<<
Looks like a Cut & Handle Formation. Break above trend line may trigger a Good Rally in all IT Stocks.
>>> NIFTY IT Hourly Chart <<<

>>> Click the chart to see on full screen <<<
Provided IT Index might be forming a Expanding like Triangle - Must cross above the Resistance for a Bullish Break out else Reversal not ruled out.
>>> NIFTY MIDCA50 Weekly Chart <<<
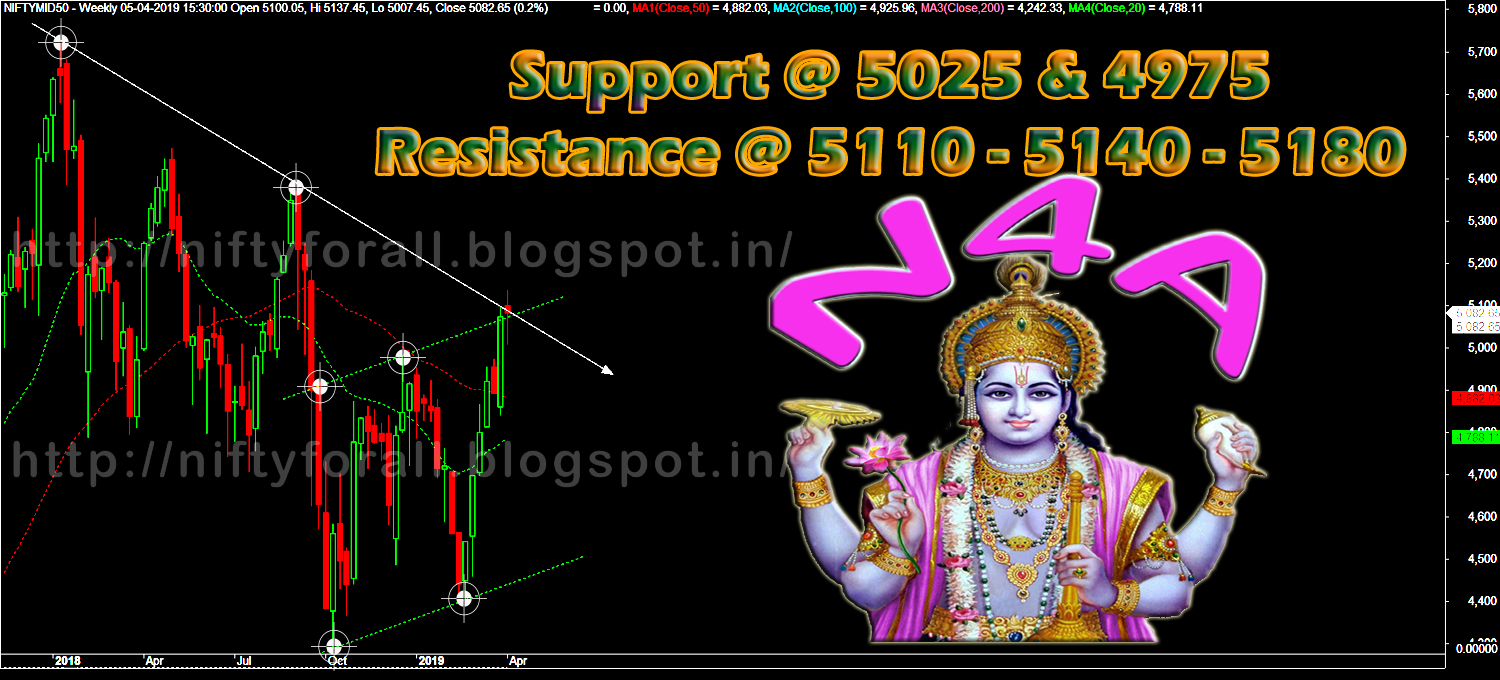
>>> Click the chart to see on full screen <<<
Possible Break out on Weekly Chart - Suggest a Rally in All Mid Cap Stocks Coming.
>>> WeekEnd Performance till 05th April 2019 <<<

>>> N4A - Combo Pack <<<

>>> N4A - Index Pack <<<

>>> N4A & Whatsapp <<<
