Dear All,
As the nation’s tryst with GST draws closer, the domestic equity market seems to be in a state of nervousness on its immediate impact. Falling crude prices and a slide in the rupee were the other key factors that weighed on market sentiment during the week gone by.
GST rollout: After a long wait of 17 years, the goods and services tax (GST) is all set to become a reality on the midnight of June 30. GST is the indirect tax reform that will replace several taxes levied by the central and state governments. It was introduced as the Constitution (122nd Amendment) Act 2017, following the passage of Constitution 122nd Amendment Bill.
Under GST umbrella, goods and services will be taxed at 0%, 5%, 12%, 18%, 28%. Gold will become slightly costlier Needless to say that the implementation of landmark tax reform goods and service tax (GST) will be the biggest driver of the markets in the days ahead.
Monsoon progress: The progress of monsoon will be watched closely. The Indian Meteorological Department (IMD) said for the country as a whole, cumulative rainfall during this year’s monsoon season up to June 22 has been 4 per cent above the long period average (LPA). The June-September south-west monsoon is critical because a considerable part of the country’s farmland is dependent on rains for irrigation.
IMD in its second stage forecast of Southwest monsoon seasonal rainfall issued on June 6 2017 had said that quantitatively monsoon seasonal rainfall for the country as a whole is likely to be 98 per cent of the long period average (LPA) with an error of ± 4 per cent.
Crude prices: Crude oil prices plunged to a 10-month low on supply glut during last week. Oil futures edged higher on Friday thanks to a lift from a weaker dollar, but finished a fifth straight week lower as Opec-led production cuts failed to substantially reduce a global crude glut. For the week, both benchmarks lost 3.9 per cent, and oil currently sits just off 10-month lows, beset by ongoing worries about rising production, reports Reuters.
Rupee movement: The local currency hit a three-week low of 64.59 against the US dollar on Friday on steady demand for the US currency amid a global oil rout. The forex market traded with a broadly hesitant tone on growing uncertainty about global economic growth as crude prices remained weak, triggering volatility in financial markets.
PM Modi to meet POTUS: Prime Minister Narendra Modi arrived in Washington on the second leg of his three-nation tour for first bilateral meeting with US President Donald Trump, and the two leaders are set to hold discussions on a set of "strategically important" issues.
US President Donald Trump will host PM Modi at the White House on Monday afternoon and the two leaders would spend about five hours together in various settings, beginning with a bilateral discussion, delegation-level talks, a reception and a working dinner, the first of its kind hosted by this administration, reports TOI.
Global cues: On the global front, investors will watch the US durable goods orders for May on Monday, June 26. New orders for the US manufactured durable goods fell 0.7% month-over-month in April 2017, following an upwardly revised 2.3% jump in March. Also, the US GDP growth rate will be declared on Thursday, June 29, 2017. The US economy expanded an annualised 1.2% on quarter in the first three months of 2017, better than the advance estimate of 0.7% growth, Capitaline data showed.
Back home, the infrastructure output data for April 2017 will be released on Friday, June 30, 2017. Infrastructure output went up 2.5% year-on-year in April of 2017 after an upwardly revised 5.3% rise in March.
>>> Nifty Weekly Chart <<<
>>> Click the chart to see on full screen <<<
Price failed to cross above 9660 for the third week in a row.
>>> Nifty Daily Chart <<<
>>> Click the chart to see on full screen <<<
Channel Broken. Next Support @ 9530.
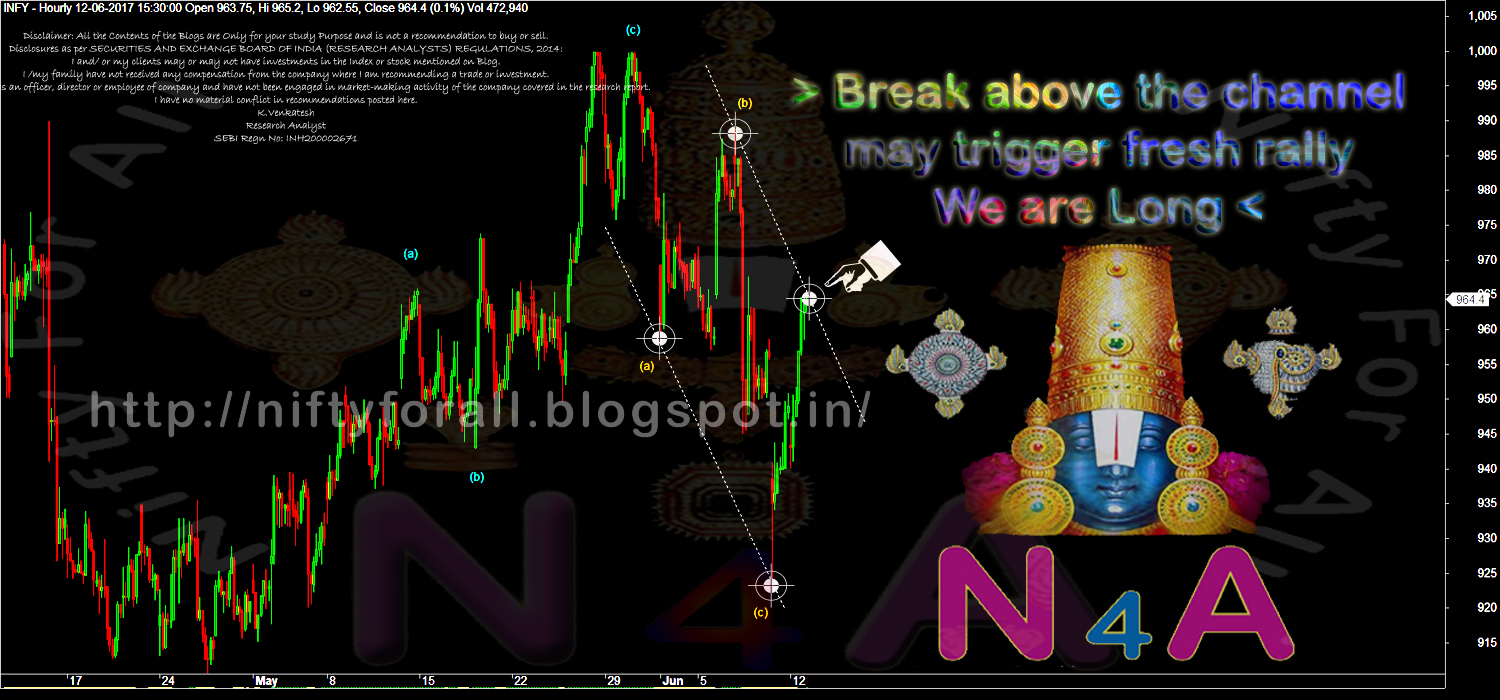
>>> Nifty Hourly Chart <<<
>>> Click the chart to see on full screen <<<
ABC formation may find its support @ 9550. Next support 9530 if breaks, makes the count invalid and more fall likely.
>>> Bank Nifty Daily Chart <<<
>>> Click the chart to see on full screen <<<
Its a Clear raising wedge like pattern. Break below the Wedge may trigger a Massive correction.
>>> Bank Nifty Hourly Chart <<<
>>> Click the chart to see on full screen <<<
Hourly Chart Suggest 23430 & 23310 as Support. Below 23310 Fall to continue.
>>> NIFTY-IT - Daily Chart <<<
>>> Click the chart to see on full screen <<<
10140 Support must hold for a Bounce back, Else may Trigger more selling.
>>> CNX-PSUBANK-CHART - Hourly Posted 14th June, 2017 <<<
>>> Click the chart to see on full screen <<<
Posted on Last Weekly Review - PSU Bank Index Stocks may rally.
>>> CNX-PSUBANK-CHART - Hourly Chart <<<
>>> Click the chart to see on full screen <<<
3430 & 3420 May support for a Good rally on PSU Index and Stocks. Breaks below may trigger selloff.
>>> Nifty MidCap50 Daily Chart - Posted Last Weekly Review <<<
>>> Click the chart to see on full screen <<<
Posted on Last Weekly Review - MidCap looking for a Correction.
>>> Nifty MidCap50 Daily Chart <<<
>>> Click the chart to see on full screen <<<
Trend line Support if breaks may trigger more correction on all Mid Cap Stocks.
>>> Nifty MidCap50 - Hourly Chart <<<
>>> Click the chart to see on full screen <<<
4477 and 4437 - Support must hold for Upmove.
>>> Performance till 23rd June 2017 <<<
>>> Click the image to see on full screen <<<
Above performance is not a Promise or guarantee for the given Profits or Loss.Performance given based on 1 lot at a time and clients Profit differ as per the margin availability and Number of Lots taken by them. We may or may not re-enter the Calls given here hit Stop Loss, as per market movement. The charts given above are just for educational purpose only and we don't recommend any Entry / Buy or Exit / Sell. Reader must taken their own decision or consult their qualified Analyst before making any decision.