Pages

Thursday, July 31, 2014

Support @ 7707 & 7670.

Dear All,

>>> Click the chart to see on full screen <<<

Turning down again - shows nifty moving down as abc-x-abc. Now the supports are 7707 previous low and 7670 where there is a small gap left. So lets wait and see.

>>> INFY <<<

>>> Click the chart to see on full screen <<<

Just Sell if breaks the channel - Sell and Earn. Cheers!!!

Wednesday, July 30, 2014

7707 Supported

Dear All,

>>> click the chart to see on full screen <<<

FnO Expiry tomorrow. Fed will release its policy decision today night as US economic data and the two-day US FOMC meet which ends today.

Nifty took support @ 7707, where as nifty fall was marked as abc. Hence tomorrow may be the trend decider. So lets wait and watch.

Monday, July 28, 2014

The CAT still on the WALL.

Dear All,


A top-ranking North Korean military official has threatened a nuclear strike on the White House and Pentagon after accusing Washington of raising military tensions on the Korean peninsula.

The threat came from Hwang Pyong-So, director of the military's General Political Bureau, during a speech to a large military rally in Pyongyang yesterday on the anniversary of the armistice that ended the 1950-53 Korean War.

Hwang, who holds the rank of vice marshal in the Korean People's Army, said a recent series of South Korea-US military drills, one of which included the deployment of a nuclear- powered US aircraft carrier, had ramped up tensions.

It is not the first time that North Korea's bellicose rhetoric has included threats of nuclear strikes on the continental United States and US bases in the Pacific.

But most experts believe it is still a long way from developing a viable intercontinental ballistic missile with the required range.

The North has conducted three nuclear tests, but is not thought to have mastered the miniaturisation techniques necessary for mounting a warhead on a missile.

It does possess a range of short-and mid-range missiles capable of striking South Korea and Japan, and has conducted a series of test firings into the Sea of Japan (East Sea) in recent weeks.

The latest test on Saturday - guided by the leader Kim Jong-Un - simulated a short-range missile strike on South Korea where 28,500 US troops are stationed, the North's state media said.

>>> NIFTY <<<

>>> click the chart to see on full screen <<<

Lot of alternatives visible on chart now. Hence the Cat is still on the wall. Need to wait and watch. So lets wait.

Saturday, July 26, 2014

Weekly Review - 28.07.2014

Dear All,


Out Look for Next Week :-

The Nifty gave a breakout from the 1000-1050 point rising channel once it crossed 6850 in May 2014 before the election results on very good volumes.

Volumes rose sharply thereafter and the Nifty made a high of 7,563 on the day of the election results. After a retracement up to 7120 odd level, the index resumed the uptrend and went on to make a high of 7809 and on Friday it made a fresh record high of 7840.95.

Last Week volumes have dipped in comparison to the prior up-moves. Most of the midcap stocks have failed to participate in the latest rally while a handful of them have actually corrected sharply.

According to most analysts, the hope-based rally is largely over and the markets are likely to consolidate in the near term, but the broader trend for the market largely remains on the upside.


India is the only big emerging economy to escape a cut in the International Monetary Fund's update of its World Economic Outlook that says the global economy seems to have tripped on an unexpected contraction in the US economy in the first quarter, which is a welcome sign.

IMF has retained its forecast of 5.4 per cent growth in the Indian economy in 2015 and a stronger 6.4 per cent growth next year.

Although macro-economic data such as IIP, inflation data points the needle in the right direction, but earnings growth for India Inc is still some quarters away, say analysts.

So lets go to Technicals and see what the Charts Says ....

>>> Nifty - Daily Chart <<<

>>> click the chart to see on full screen <<<

If the above count is not wrong - then expect nifty to perform till or above 8000. Lets see one more probability also.

>>> Alternative Nifty view on Daily Chart <<<

>>> click the chart to see on full screen <<<

of course its a expanding triangle - price got resisted on the top of it. So if Price fails to cross the channel - price may reach till then below channel as shown on chart.

>>> Bank Nifty <<<

>>> click the chart to see on full screen <<<

Nothing more to say than in chart. Lets wait and see.

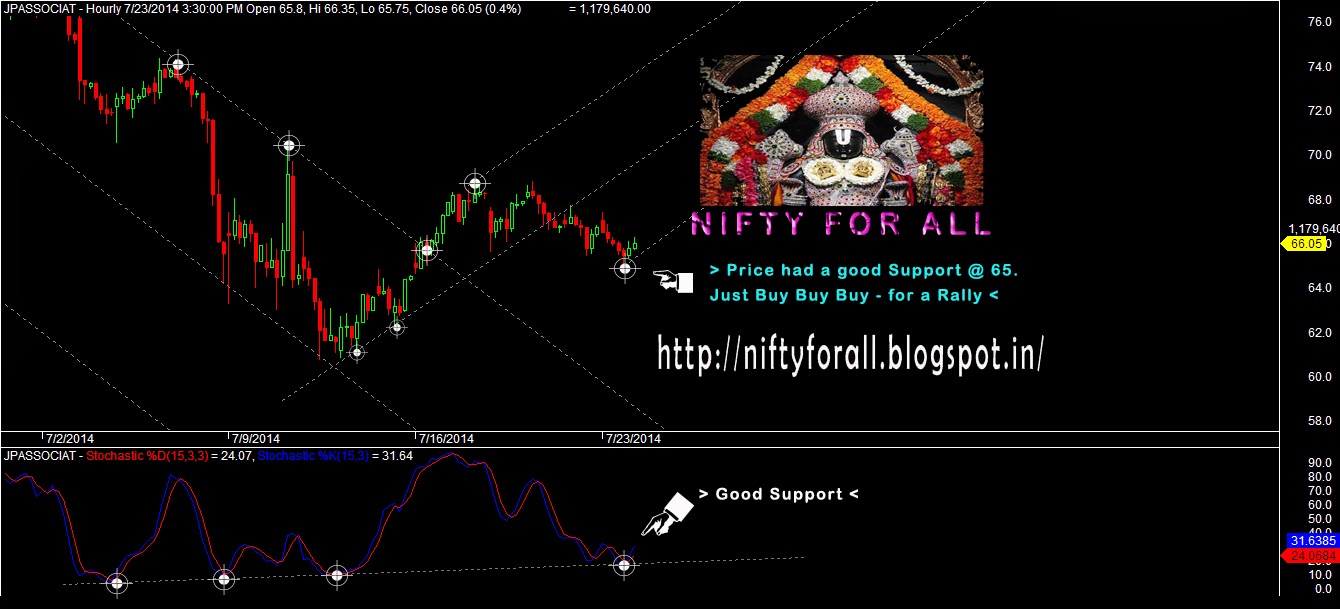
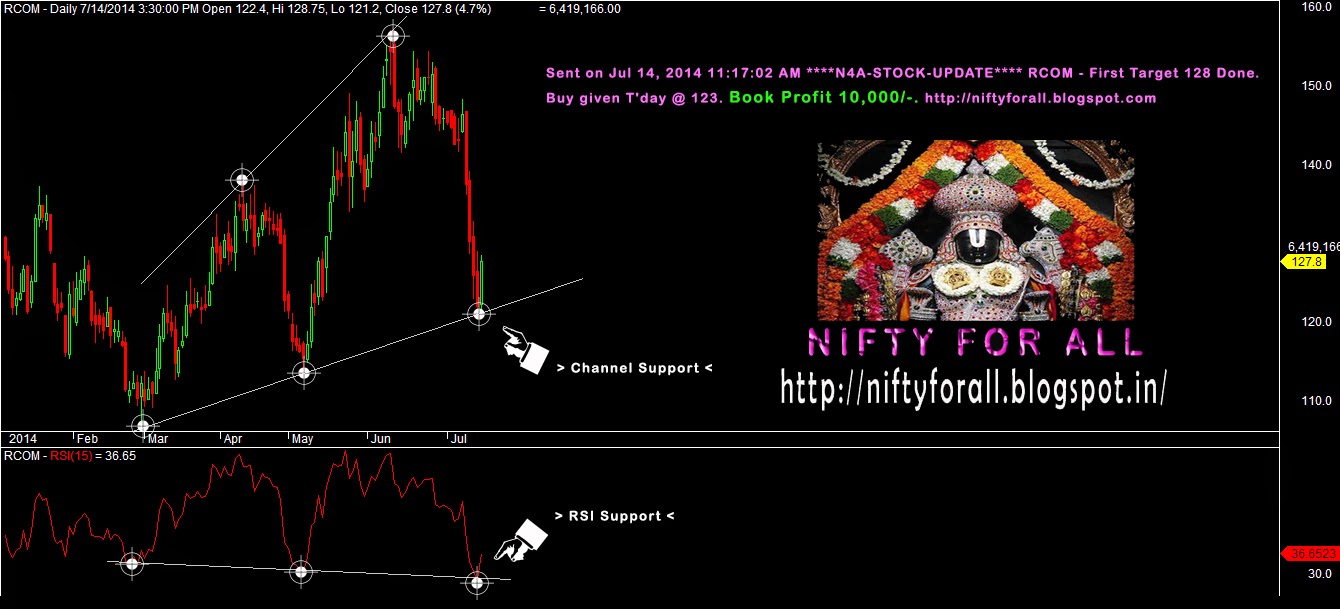
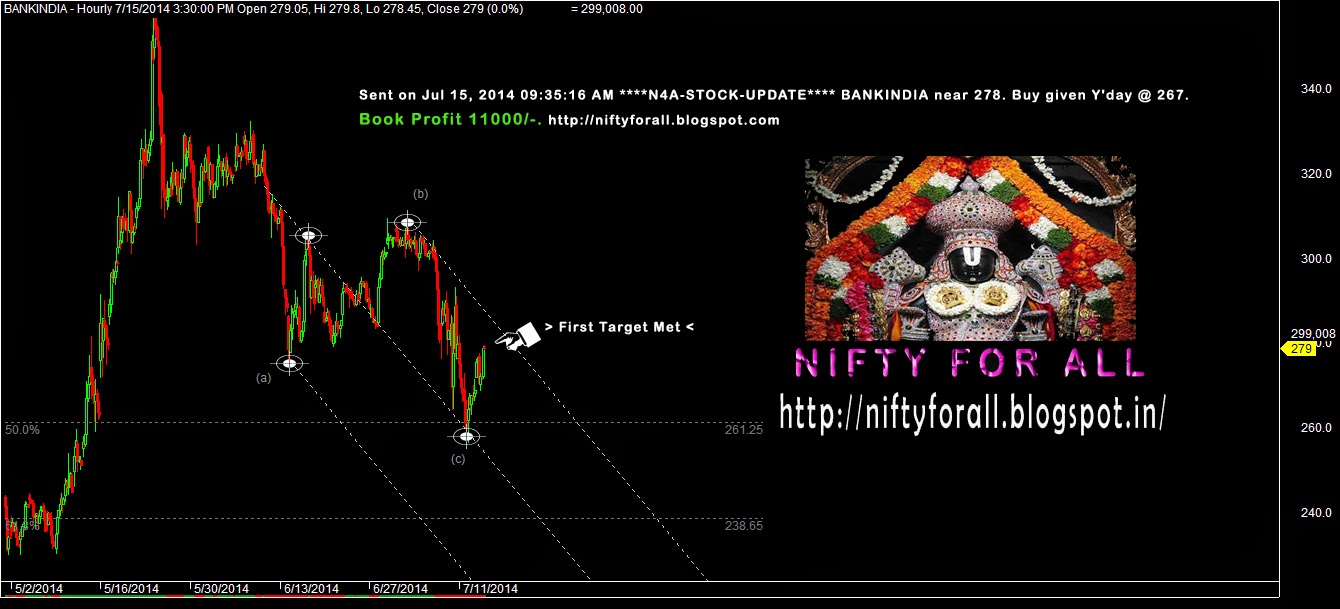
>>> PERFORMANCE till 25th July 2014 <<<

>>> click the chart to see on full screen <<<

Please contact niftyforall@yahoo.com for details.

Thursday, July 24, 2014

Crossed 7809

Dear All,

>>> Click the chart to see on full screen <<<

So 7809 crossed as expected. But broader market looks weak with lot of volatile and choppiness. Looks very difficult to trade, as either side may hit stop loss.

>>> JP Associates - As posted Yeterday <<<

>>> Click the chart to see on full screen <<<

Yesterday we recommend to Buy JP Associates - Hit Stop Loss today. After the news of Taqa India Power Ventures withdraw from their acquisition agreement, price fell down to hit stop loss.

Lets see what to happen next ..??

>>> Yet to Happen <<<

>>> Click the chart to see on full screen <<<

If 61.4 and 61.8 holds tomorrow - then expect a good bounce. Let's See. Cheers!!!

Wednesday, July 23, 2014

7809 - Resisted

Dear All,

>>> click the chart to see on full screen <<<

As wrote Yesterday - 7809 resisted - Until we cross this hurdle - Market going to be choppy and volatile. So the most frequently asked questions like - Was the market Topped Out ???? - The answer is - still no valid trigger or break down for such correction - FII's are still on buying spree. Hence shorting is not advisable at this point. Remain Long at this point with proper stop loss is advisable. Due to high volatile - Some Trade may hit Stop loss - are unavoidable.

>>> JPASSOCIATES <<<

>>> click the chart to see on full screen <<<

Stock looks very attractive - with a good support @ 65. Just Buy for good Rally.

>>> BIOCON - As Posted Yesterday <<<

>>> click the chart to see on full screen <<<

Wrote Yesterday about Break out on Biocon.. Let's See what happened.

>>> Happened and Yet to <<<

>>> click the chart to see on full screen <<<

We had a Part Booking at 522 or 61.8% fib level for Rs.5000. Lets See. Cheers!!!

Tuesday, July 22, 2014

Final Hurdle @ 7809

Dear All,

>>> Click the chart to see on full screen <<<

No doubt many are frustrated by the volatility on Market. Many forced to went short or may have purchased PUT Options. So above chart is the answer for all your troubles and loss. Yes we are in the Last Leg of upmove. The nature of this Last leg should be volatile in nature. One should buy on every dips and must avoid Shorts. Must trade with lot of patience.

>>> Nifty - Hourly Chart - Posted on 18th July 2014 <<<

>>> Click the chart to see on full screen <<<

On Last weekly review wrote clearly - about the Moving Average Cross over and 7661 Resistance. See what happened today.

>>> Happened <<<

>>> Click the chart to see on full screen <<<

Its a good rally today. Finally Nifty facing hurdle at all time high of 7809. So lets wait and see.

>>> DR.Reddy's Lab - As posted on 17th July 2014 <<<

>>> Click the chart to see on full screen <<<

We told to Buy Dr.Reddy's Lab on 17th July. See what happened today.

>>> Happened and Yet to <<<

>>> Click the chart to see on full screen <<<

First target met with a profit of Rs.7625. Price made a high of 2733 - More rally on card.

>>> BIOCON <<<

>>> Click the chart to see on full screen <<<

No doubt we are long in this counter from 512 onwards. Clear break out shows more rally possible. Just buy and enjoy. Cheers!!!

Monday, July 21, 2014

Resistance 7726-7731

Dear All,

>>> Click the chart to see on full screen <<<

Seems like bears coming back into the game. First Sign of weakness if Price can't cross the Key Resistance above 7726-7731. Hourly Chart shows some break down on price and RSI. So its time to be cautious. Traders must avoid aggressive Longs and must enter into defensive stocks.

>>> MCLEODRUSS <<<

>>> Click the chart to see on full screen <<<

Mcleodruss - Looks bullish. Support @ 277, if holds then good rally possible. We have booked part profit of Rs.5000 today. Just buy on dips - more rally possible. Cheers!!!

Sunday, July 20, 2014

Weekly Review - 21.07.2014

Dear All,

>>> Nifty - Daily Chart <<<

>>> Click the chart to see on full screen <<<

Daily chart looks like relief rally - hence the fall marked as wave (a) or (4). So to make it confirm about the rally to continue - we need more confirmation - Lets see in detail on hourly chart.

FII's started buying since last week - indicates the rally may continue.

>>> Nifty - Hourly Chart <<<
>>> Click the chart to see on full screen <<<

Moving Average Crossed now. But still 7661 remains a hurdle. So lets wait and see.

>>> Bank Nifty <<<

>>> Click the chart to see on full screen <<<

Bank nifty - RSI on a break out mode. Price yet to give a break out.

>>> Last week Chart Performance <<<

>>> Rcom <<<

>>> Click the chart to see on full screen <<<

>>> Bank India <<<

>>> Click the chart to see on full screen <<<

>>> Andhra Bank <<<

>>> Click the chart to see on full screen <<<

>>> M&MFin <<<

>>> Click the chart to see on full screen <<<

>>> IDBI <<<

>>> Click the chart to see on full screen <<<


>>> Jindal Steel <<<

>>> Click the chart to see on full screen <<<

>>> Performance - till 18th July - 2014 <<<
>>> Click the image to see on full screen <<<

>>> L&T Finance Holding Ltd., - Special Coverage - Follow Up <<<

Reserve Bank of India’s recent move to ease infrastructure loans is a positive.

L&T Finance Holdings' Q1 results on July 23, 2014


>>> As Posted on 27th June - 2014 <<<

>>> Click the image to see on full screen <<<

Last time the bounce did not happen as expected and hit a low of 67. So lets see what the chart says now.

>>> What to Happen <<<

>>> Click the image to see on full screen <<<

RSI gave a clear break out - So we need a break our from Price above the channel - as shown on chart. If breaks then rally to continue. Cheers!!!

Thursday, July 17, 2014

Resistance @ 7660-61

Dear All,

>>> Click the chart to see on full screen <<<

One more choppy trading today. Looks like a "A Cat on a Wall". So what's Cooking ???. As per the above chart - Nifty may see a hurdle at 7660-61, if able to cross may see a good upmove and short covering. Moving Average Cross over should be watched. Unlike previous sessions - Cross over has not completed yet. If gets completed, then rally to continue. So let's wait and see.

>>> JINDALSTEL <<<

>>> Click the chart to see on full screen <<<

Ofcourse first target not met, stock made a high of 303. so far we made 10,000. Well - looks like more moves pending.

>>> DRREDDY <<<

>>> Click the chart to see on full screen <<<

Yes - a Clear break out on chart. Just Buy for rally. Cheers!!!

Wednesday, July 16, 2014

Break Out or Bear Trap ?!?!?!

Dear All,

>>> Nifty As Posted Yesterday <<<

>>> Click the chart to see on full screen <<<

Wrote Yesterday that we are long from 7460 and waiting for rally, See what happened !

>>> Happened and Yet to <<<

>>> Click the chart to see on full screen <<<

Yes we got our First Target at 7600 from 7460. Chart looks like a break out. Should we expect more rally ??. Lets See.

>>> Bank Nifty <<<

>>> Click the chart to see on full screen <<<

Yes Bank Nifty also looks like a break out. We are long in many bank stocks this week. So just get ready to enjoy more rally.

>>> Bank India - As Posted Yesterday <<<

>>> Click the chart to see on full screen <<<

Wrote Yesterday more rally coming on Bank of India. See what happened ???

>>> Happened <<<

>>> Click the chart to see on full screen <<<

Bank of India Rallied from 267 to 285 above the second target with a Profit of Rs.19000.

>>> Andhra Bank - As Posted Yesterday<<<

>>> Click the chart to see on full screen <<<

Yesterday - Wrote clearly - Andhra Bank completed Wave C and get ready for a pull back rally from here. See what happened today.

>>> Happened and Yet to <<<

>>> Click the chart to see on full screen <<<

We booked Part Profit for Rs.12000. So wait for more rally to come in.

>>> M&MFin <<<

>>> Click the chart to see on full screen <<<

M&MFin gave us Rs.10,000 Profit today. More rally coming !

>>> IDBI <<<

>>> Click the chart to see on full screen <<<

Yes again a Part Profit of Rs.8000. So wait for more upmove. Cheers!!!