Dear All,
Indian equities outperformed global benchmarks despite some geopolitical concerns. CPI data for the month of June continued to be soft despite reports of a spike in fruits and vegetables prices. This along with the weak IIP number opens the door for a possible rate cut in the August monetary policy meeting.
During the week, domestic macroeconomic data points -- Consumer Price Index (CPI), Index of Industrial Production (IIP) and Wholesale Price Index (WPI) -- were released.
Data showed that India's annual retail inflation (CPI) eased to a record low of 1.54 per cent during June -- lowest since 1999 -- while the country's factory output growth (IIP) slowed to 1.7 per cent in May.
Provisional figures from the stock exchanges showed that foreign institutional investors (FIIs) purchased stocks worth Rs 1,259.98 crore, while domestic institutional investors (DIIs) bought scrip worth Rs 2,361.61 crore during July 10-14.
Figures from the National Securities Depository (NSDL) revealed that foreign portfolio investors (FPIs) invested in a total of equities worth Rs 366.44 crore, or $57.01 million, during the week ended July 14.
On the currency front, the Indian rupee strengthened by 14 paise to close at 64.45 against the US dollar from its last week's close.
Also SEBI (Securities and Exchange Board of India) released a report that prohibits promissory notes from taking any unhedged derivative position exposure. It also clarified that 'hedging of equity shares' means taking a one-to-one position in the same stock.
Will the bulls continue their thunderous march in the coming week? Here are the top factors that will guide market direction in the next week.
Q1 report card:- While TCS disappointed the Street with a bigger-than-expected drop in its PAT of 10 per cent to Rs Rs 5,945 crore, Infosys gave some ray of hope, as the IT firm reported a 3.3 per cent sequential drop in net profit at Rs 3,483 crore for June quarter. The numbers beat Rs 3,429 crore profit estimate projected by analysts in an ETNow poll.
The top factors that will guide market direction in the next week :-
Trade deficit widens:- India's trade deficit widened to $12.96 billion in June against $8.11 billion in June 2016, the data released by the Commerce Ministry showed. The exports grew by 4.39 per cent to $23.56 billion in the month under review while the imports shot up by 19 per cent to $36.52 billion in June from $30.68 billion in the year-ago month due to rise in inward shipments of oil and gold.
Will the Dragon spew fire in Q2?:- The world's second biggest economy will unveil GDP data for its second quarter on Sunday, July 16, 2017. It is expected to top the government target to reach 6.6 per cent in 2017, tempering initial worries of a sharper slowdown as Beijing walks a policy tightrope with its quest to crackdown on financial risks and limit damage to the economy, Reuters reported.
The economy grew a surprisingly solid 6.9 per cent in the first quarter, buoyed by a gravity-defying property boom and higher government infrastructure spending which helped boost industrial output by the most in over two years.
The country's industrial production data for June 2017 is also due on Sunday, 16 July 2017.
Bank of Japan policy meet:- Japan's central bank is expected to hold off from expanding stimulus at its two-day rate review ending next Thursday (July 20), as robust exports and private consumption heighten prospects of a moderate economic expansion.
According to a Reuters report, the bank's nine-member board is divided between those who expect a strengthening economy to start pushing up inflation, and those who believe inflation will remain subdued well into next year given Japan's sticky deflationary mindset.
ECB policy meet:- The European Central Bank will hold its rate-setting meeting on July 20, where no big changes are expected.
The bank may drop a reference to its readiness to increase the size or duration of its asset-purchase programme before announcing in the autumn how and when it will start winding down its bond-buying.
These apart, progress of monsoon rains, movement of rupee and crude prices will also impact market in the coming week.
>>> NIFTY - Daily Chart <<<
>>> Click the chart to see on full screen <<<
Price may find its resistance 9910-20 or Channel top @ 9950. May be its an end of Rally. If so, We may see a Good Correction.
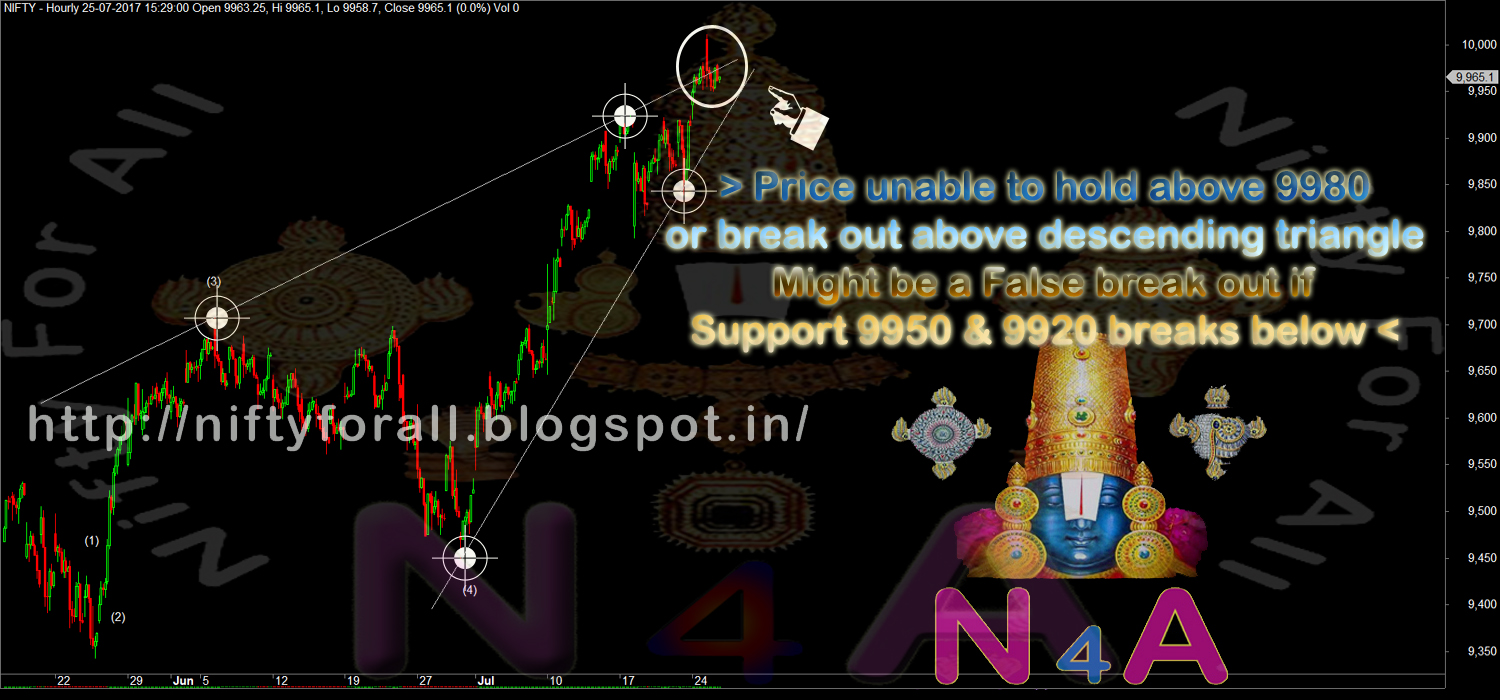
>>> NIFTY - Hourly Chart <<<
>>> Click the chart to see on full screen <<<
Price and RSI broken the wedge - May give a throw back rally if crosses above 9910-9920. Else price may continue to fall below 9845.
>>> NIFTY 5 Mins chart <<<
>>> Click the chart to see on full screen <<<
Above is a 5 mins chart - Tried to sold the Puzzle of Bulls. Above 9910-20 may test next Resistance 9950. If breaks below 9845 - May Trigger more sell off till 9806 and 9775.
>>> BANK NIFTY - Daily Chart <<<
>>> Click the chart to see on full screen <<<
Bank Nifty May trigger may rally above 23860-23900.
>>> BANK NIFTY - Hourly Chart <<<
>>> Click the chart to see on full screen <<<
Bank Nifty Hourly Chart Suggest 23990.
>>> BANKNIFTY - 5 Mins Chart <<<
>>> Click the chart to see on full screen <<<
5 mins also suggest Resistance @ 23980-23990.
>>> PSUBANKNIFTY - Daily - Posted on 06th July 2017 <<<
>>> Click the chart to see on full screen <<<
Posted on 06th July, 2017 > Price may rally above 3420.
>>> PSUBANKNIFTY - Daily - Happened <<<
>>> Click the chart to see on full screen <<<
Above Chart looks like a H&S, Resistance 3560 & 3590 if not crossed - Caution on all PSU Bank Stocks.
>>> CNXMIDCAP50 - Daily Chart - Posted on Last Weekly Review <<<
>>> Click the chart to see on full screen <<<
Posted on last weekly review - above 4655 - may test 4720.
>>> CNXMIDCAP50 - Daily Chart - Almost tested near 4720 <<<
>>> Click the chart to see on full screen <<<
4720 is a Stiff resistance - above may test 4735-40. Caution on all Mid Cap Stocks also.
>>> CNXIT-Hourly- Posted on Weekly Review <<<
>>> Click the chart to see on full screen <<<
Posted 10040-45 as a Good Support
>>> CNXIT - Hourly - Support @ 10240-10260 <<<
>>> Click the chart to see on full screen <<<
CNXIT - Resisted at 10610-630. Support if breaks below 10240-10260 more fall likely. Watch IT Stocks.
>>> CNXMETAL - Daily Chart - Posted on 11th July 2017 <<<
>>> Click the chart to see on full screen <<<
Posted on 11th July, 2017, 3150 as a Key Resistance. Watch Metal Stocks with Caution if 3150 unable to cross.
>>> VEDL - Daily Chart - Posted on 11th July 2017 <<<
>>> Click the chart to see on full screen <<<
Posted as 263-264 as Key Resistance.
>>> VEDL - Hourly Chart - Hold Short till 267.70 <<<
>>> Click the chart to see on full screen <<<
Remain short till it breaks above 267.7.
>>> CNXAUTO - Daily Chart - Caution Advised <<<
>>> Click the chart to see on full screen <<<
Auto Index looks week and facing Resistance @ 10955-560, If not crossed - Expect Correction. Caution on all Auto Stocks.
>>> ASHOKLEY - Daily Chart <<<
>>> Click the chart to see on full screen <<<
Resistance @ 107.50 - 108 - If not crossed - Expect Correction.
>>> Performance till 14th July 2017 <<<
>>> Click the image to see on full screen <<<
Above performance is not a Promise or guarantee for the given Profits or Loss.Performance given based on 1 lot at a time and clients Profit differ as per the margin availability and Number of Lots taken by them. We may or may not re-enter the Calls given here hit Stop Loss, as per market movement. The charts given above are just for educational purpose only and we don't recommend any Entry / Buy or Exit / Sell. Reader must taken their own decision or consult their qualified Analyst before making any decision.