The Bank of Japan has announced a modest expansion of its monetary easing programme, blaming Britain’s decision to leave the European Union as the biggest uncertainty facing world markets.
The central bank acknowledged government pressure for more action to drive the yen lower and help Japan’s legion of exporters, but stopped short of upping its bond purchases or cutting interest rates.
“Against the backdrop of the United Kingdom’s vote to leave the European Union and the slowdown in emerging economies, uncertainties surrounding overseas economies have increased and volatile developments have continued in global financial markets,” the bank said in a statement eagerly awaited by investors around the world.
The bank had acted “in order to prevent these uncertainties from leading to a deterioration in business confidence and consumer sentiment”.

Some market experts said the lack of bold action suggested the bank had decided that the effectiveness of its huge monetary easing programme had reached its limits.
“Is this guidance that we may actually see negative rates being reversed? I suspect it could be,” he said in a note to clients. “It’s obvious that there has been a mini credit crunch in Japan and the banks have underperformed. Negative rates haven’t worked, in fact they have been a huge negative.”
Japanese officials were under intense pressure to deliver as economists increasingly write off prime minister Shinzo Abe’s faltering bid to fire up the world’s number three economy, dubbed Abenomics.
The UK referendum result in June hammered financial markets and sparked a yen rally that is threatening corporate Japan’s bottom line – and aggravating concerns about growth.
Abe announced a huge $266bn fiscal stimulus for the economy on Wednesday but government figures on Friday morning underlined the scale of the problems facing the country.
Spending by households across the country fell in June while inflation dropped for a fourth straight month, in a fresh blow to Abe’s war on deflation.
But the Bank of Japan said it would maintain its base money target at 80 trillion yen ($775bn) as well as the pace of purchases for other assets including Japanese government bonds.
It also left unchanged the 0.1% interest it charges to a portion of excess reserves financial institutions park with the central bank.
The BOJ said it would increase exchange-traded funds purchases so that its total holdings increase at an annual pace of 6 trillion yen ($57bn), up from the current 3.3 trillion yen. The decision was made by a 7-2 vote.
“The BOJ believes that its monetary policy measures and the government’s initiatives will produce synergy effects on the economy,” the bank said.
Business confidence has slumped to levels last seen when Abe won power in late 2012 on a ticket to fire up an economy beset by years of falling prices and weak growth.
>>> Morgan Stanley Warns Currency Traders Worst to Come for Dollar <<<
The dollar is set to fall 5 percent in the next few months, the Federal Reserve isn’t raising interest rates anytime soon and U.S. economic data is only going to get worse. That’s what Morgan Stanley chief global currency strategist Hans Redeker told clients in a note published Thursday, citing in-house indicators showing U.S. domestic demand is set to fade in the coming months. It didn’t take long for markets to prove him prescient. The greenback fell 1.3 percent Friday, capping its worst week since April, after the Commerce Department said U.S. second-quarter gross domestic product advanced at about half the rate economists had forecast.

“We are quite pessimistic about, first, the outcome of the U.S. economy,” Redeker said in an interview on Bloomberg Television Friday, before the GDP report’s release. “When you look at our internal indicators, which capture domestic demand very well, they are suggesting that the demand strength is going to fade from here.”
The greenback had rallied in recent weeks on mounting speculation the Fed will hike rates in the coming months following better-than-expected data on jobs, retail sales and industrial production. Dollar bulls’ hopes were dampened Wednesday after a lukewarm policy statement from Fed officials that signaled only a gradual pace towards tighter monetary policy. They were dashed after Friday’s GDP print, which showed a 1.2 percent annualized increase in the April-June period, less than the 2.5 percent median forecast of economists surveyed by Bloomberg.
Further dollar strength will be limited as policy divergence between the U.S., Japan and Europe slows, according to Steven Englander, global head of Group-of-10 currency strategy at Citigroup Inc.
“The dollar still benefits when U.S. growth looks OK, but call it a limping divergence trade, not the kind of divergence trade we were talking about last year or the year before,” Englander said Friday on Bloomberg Television.
>>>> Nifty Daily Chart <<<

>>> Click the chart to see on full screen <<<
Price may face resistance near 8670 and 8705-8710.
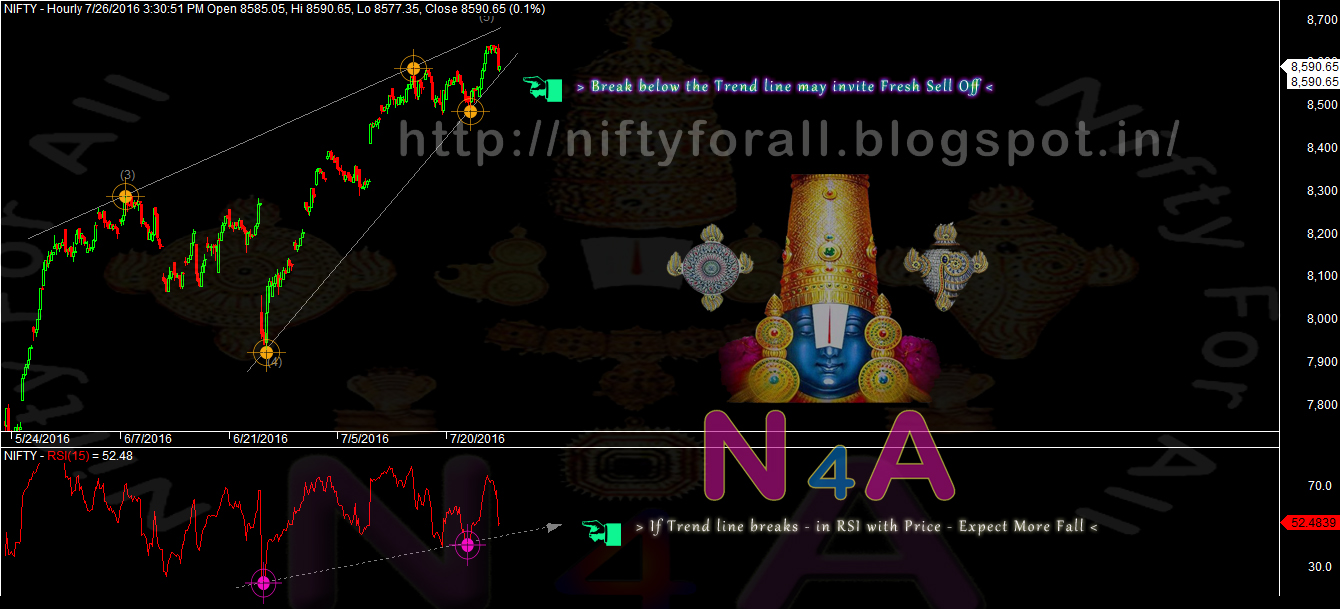
>>> Nifty Hourly Chart <<<

>>> Click the chart to see on full screen <<<
Price must Cross the resistance given on channel 8670,8690 & 8710 next week to continue the rally.
>>> Bank Nifty Daily Chart <<<

>>> Click the chart to see on full screen <<<
Price if breaks the wedge, possible may invite sell off.
>>> Bank Nifty Hourly Chart <<<

>>> Click the chart to see on full screen <<<
Price if breaks the trend line again - Correction possible.
>>> DRREDDY - Posted on Last Weekly Review <<<

>>> Click the chart to see on full screen <<<
Wrote last weekly review - DrReddy Lab may correct. See what happened.
>>> DRREDDY - Booked Profit <<<

>>> Click the chart to see on full screen <<<
Probably we have exited and booked a bit earlier, when we saw the Price fell till 2930 on friday. Hope many readers might have shorted and enjoyed the stock.
>>> JUSTDIAL - Daily Chart <<<

>>> Click the chart to see on full screen <<<
We are Long in Just Dial - Price broken out from a Falling wedge and Expect a Rally if price continues to stay above the channel. Cheers.
>>> Performance for the month end of July 2016 <<<

>>> Click the chart to see on full screen <<<
Above performance is not a Promise or guarantee for the given Profits. Performance given based on 1 lot at a time and clients Profit differ as per the margin availability and Number of Lots taken by them. We may or may not re-enter the Calls given here hit Stop Loss, as per market movement. The charts given above are just for educational purpose only and we don't recommend any Entry / Buy or Exit / Sell. Reader must taken their own decision or consult their qualified Analyst before making any decision.