Pages

Saturday, April 27, 2019

NIFTY :- Weekly Close Above 11761 Is a Big Trigger

Dear All,

>>> NIFTY Weekly Chart <<<


11761 On Weekly Closing is a Key Trigger.

>>> NIFTY - PCG - Client - 25th April 2019 <<<

>>> Click the chart to see on full screen <<<

Above chart was send to all our Clients to HOLD Long.

>>> NIFTY - So What's Next Week Update <<<

>>> Click the chart to see on full screen <<<

Watch Resistance @ 11760-11780

>>> Bank NIFTY Daily Chart <<<

>>> Click the chart to see on full screen <<<

Watch Support & Resistance.

>>> Bank NIFTY Hourly Chart <<<

>>> Click the chart to see on full screen <<<

Watch Resistance @ 30040.

>>> N4A - Index Pack <<<


>>> N4A - Combo Pack <<<


>>> N4A & Whatsapp <<<

Wednesday, April 24, 2019

NIFTY :- Spot Above 11740 - More Rally

Dear All,

>>> NIFTY Hourly Chart <<<

>>> Click the chart to see on fulls screen <<<

We are Holding LONG.

>>> Bank NIFTY Hourly Chart <<<

>>> Click the chart to see on fulls screen <<<

We are Holding LONG.

>>> N4A - Combo Pack <<<


>>> N4A - Index Pack <<<


>>> N4A & Whatsapp <<<

Friday, April 19, 2019

Weekly Review - 22nd April, 2019

Dear All,

>>> NIFTY Daily Chart <<<

>>> Click the chart to see on full screen <<<

NIFTY Price movement after 11545 with a clear Negative Divergence. Last Candle was a Dark Cloud Cover - Which closed below 11761 - shows a Warning Sign.


>>> NIFTY Hourly Chart <<<

>>> Click the chart to see on full screen <<<

Price Resisted on the Middle Line. Next Support to watch @ 11730 & 11680 Below more fall likely.

>>> BankNIFTY Daily Chart <<<

>>> Click the chart to see on full screen <<<

Bearish Engulfing Candle - Price breaks and closed below Previous day Low. Looks like a Head & Shoulder also.

>>> BankNIFTY Hourly Chart <<<

>>> Click the chart to see on full screen <<<

Support @ 29800.

>>> CNX NIFTY PSU Banks Daily Chart <<<

>>> Click the chart to see on full screen <<<

Might be a Sign of Caution... Worst fall Possible.

>>> CNX AUTO Daily Chart <<<


>>> Performance for the WeekEnd till 18th April 2019 <<<


Above performance is not a Promise or guarantee for the given Profits or Loss.Performance given based on 1 lot at a time and clients Profit differ as per the margin availability and Number of Lots taken by them. We may or may not re-enter the Calls given here hit Stop Loss, as per market movement. The charts given above are just for educational purpose only and we don't recommend any Entry / Buy or Exit / Sell. Reader must taken their own decision or consult their qualified Analyst before making any decision.

>>> N4A - Combo Pack <<<


>>> N4A - Index Pack <<<


>>> N4A & Whatsapp <<<


Tuesday, April 09, 2019

NIFTY :- Resistance @ 11680 & 11720

Dear All,

>>> NIFTY Hourly Chart <<<

>>> Click the chart to see on full screen <<<

holding Long.

>>> Bank NIFTY Hourly Chart <<<

>>> Click the chart to see on full screen <<<

Holding LONG

>>> N4A Combo Pack <<<


>>> N4A - Index Pack <<<


>>> N4A & Whatsapp <<<

Sunday, April 07, 2019

Weekly Review - 08.04.2019

Dear All,

>>> NIFTY Weekly Chart <<<

>>> Click the chart to see on full screen <<<

Above 11760 - May trigger more rally till 12000 - 12200.

>>> NIFTY Hourly Chart <<<

>>> Click the chart to see on full screen <<<

Resistance @ 11720 & 11760. We are Holding LONG.

>>> BANK Nifty Weekly Chart <<<

>>> Click the chart to see on full screen <<<

Possible Break out Weekly Chart - May Trigger more rally.

>>> Bank NIFTY Daily Chart <<<

>>> Click the chart to see on full screen <<<

Watch Resistance & Support.

>>> NIFTY IT - Daily Chart <<<
>>> Click the chart to see on full screen <<<

Looks like a Cut & Handle Formation. Break above trend line may trigger a Good Rally in all IT Stocks.

>>> NIFTY IT Hourly Chart <<<

>>> Click the chart to see on full screen <<<

Provided IT Index might be forming a Expanding like Triangle - Must cross above the Resistance for a Bullish Break out else Reversal not ruled out.

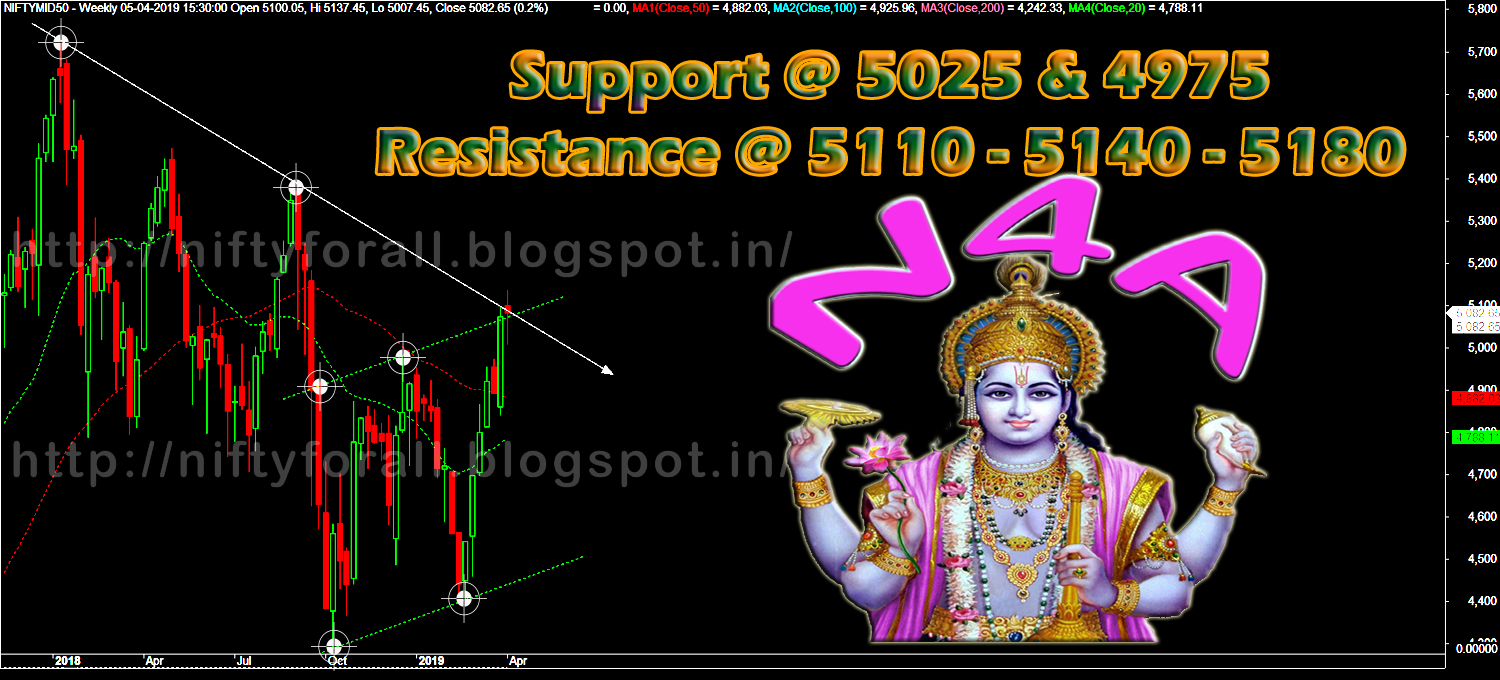
>>> NIFTY MIDCA50 Weekly Chart <<<

>>> Click the chart to see on full screen <<<

Possible Break out on Weekly Chart - Suggest a Rally in All Mid Cap Stocks Coming.

>>> WeekEnd Performance till 05th April 2019 <<<

Above performance is not a Promise or guarantee for the given Profits or Loss.Performance given based on 1 lot at a time and clients Profit differ as per the margin availability and Number of Lots taken by them. We may or may not re-enter the Calls given here hit Stop Loss, as per market movement. The charts given above are just for educational purpose only and we don't recommend any Entry / Buy or Exit / Sell. Reader must taken their own decision or consult their qualified Analyst before making any decision

>>> N4A - Combo Pack <<<


>>> N4A - Index Pack <<<


>>> N4A & Whatsapp <<<


Thursday, April 04, 2019

NIFTY :- Support @ 11560

Dear All,

>>> NIFTY Hourly Chart <<<

>>> Click the chart to see on full screen <<<

No Holding with us, Booked Profit @ 11560.

>>> N4A & Whatsapp <<<


Wednesday, April 03, 2019

Caution....

Dear All,

>>> NIFTY Hourly Chart <<<

>>> click the chart to see on full screen <<<

Caution Advised

>>> N4A & Whatsapp <<<