Pages

Thursday, August 30, 2018

Support @ 11650 & 11590

Dear All,

>>> NIFTY Hourly Chart <<<

>>> Click the chart to see on full screen <<<

11650 if breaks may test 11590 & 11560.

>>> Bank Nifty Hourly Chart <<<

>>> Click the chart to see on full screen <<<

27980 if breaks may test 27720 & 27515.

>>> AshokLeyland - Hourly Chart - Holding Short <<<

>>> Click the chart to see on full screen <<<

Broken the wedge, may trigger more correction.

>>> N4A & Whatsapp <<<

Tuesday, August 28, 2018

Resistance @ 11750-760

Dear All,

>>> NIFTY Hourly Chart <<<

>>> Click the chart to see on full screen <<<


Fail to cross above 11750 may trigger sell off, if fails to hold the support given on chart. Cheers!!!

>>> N4A & Whatsapp <<<

Sunday, August 26, 2018

Weekly Review - 27th August, 2018

Dear All,


>>> NIFTY Weekly Chart - Posted on 27th July 2018 <<<

>>> Click the chart to see on full screen <<<

Wrote before 1 month - No Sign of Weakness - May test above 11400. As mentioned, Price tested above 11600, So what's Next ?

>>> NIFTY Weekly Chart <<<

>>> Click the chart to see on full screen <<<

Resistance @ 11620. Expect Some consolidation next week.

>>> NIFTY Daily Chart <<<

>>> Click the chart to see on full screen <<<

Watch 11620 & 11680 for Next Move.

>>> NIFTY Hourly Chart <<<

>>> Click the chart to see on full screen <<<

Gap Up and Gap down's are Usual in this Highly Volatile Market. So expect a Volatile Consolidation Next week and may happen till the support @ 11550 - 11510 - 11480.


>>> BANK NIFTY - Weekly Chart - Posted on 27th July 2018 <<<

>>> Click the chart to see on full screen <<<

Wrote last week, A Healthy sign on PSU and PVT Bank Space may lead to a healthy rally.

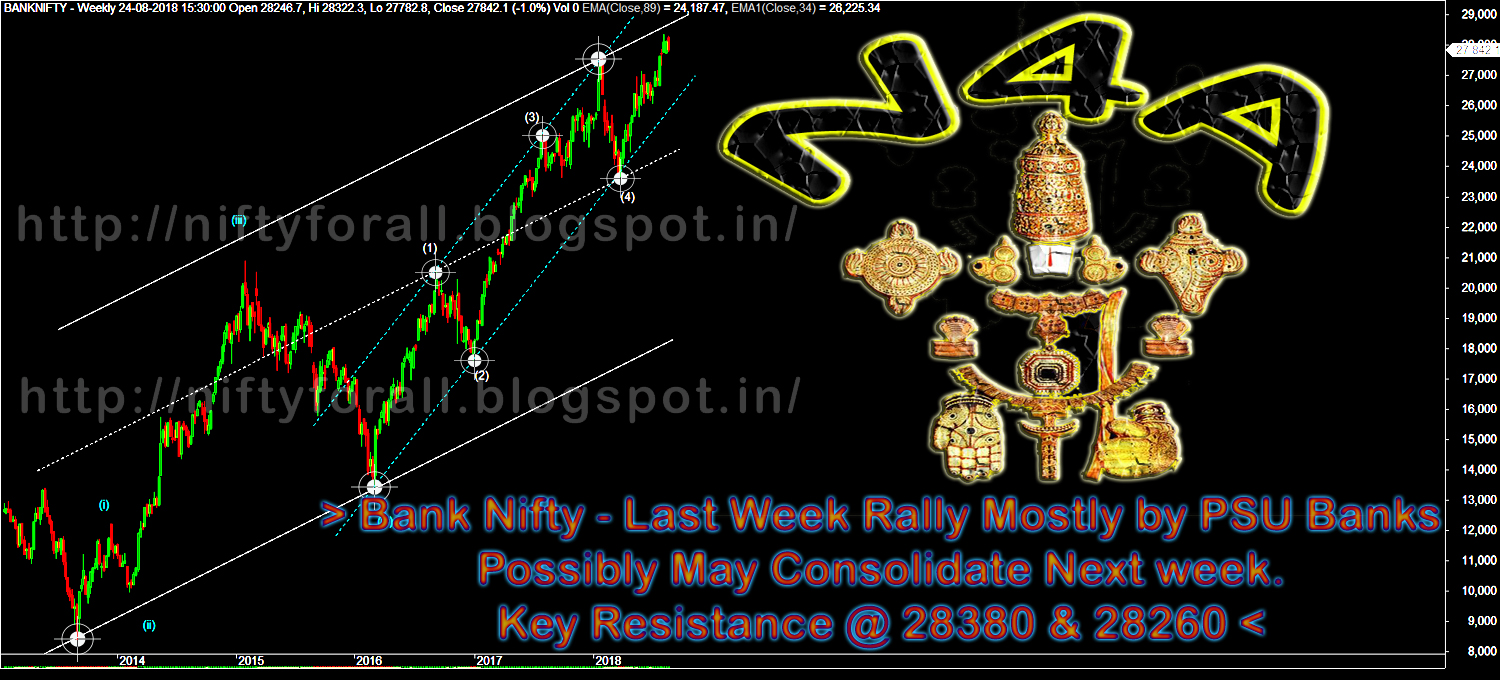
>>> BANK NIFTY - Weekly Chart <<<

>>> Click the chart to see on full screen <<<

As mentioned before 1 month, almost 600+ rally happened. Now 28380 & 28260 might act as a resistance.

>>> BANKNIFTY - Daily Chart <<<

>>> Click the chart to see on full screen <<<

Watch Support @ 27715 & 27510. Some Pvt Corporate Lenders are Looking Weak, May correct along with some PSU Banks also.

>>> WOCKPHARMA - Posted on 12th August, 2018 <<<

>>> Click the chart to see on full screen <<<

Posted on 12th Aug, 2018 - We are Long.

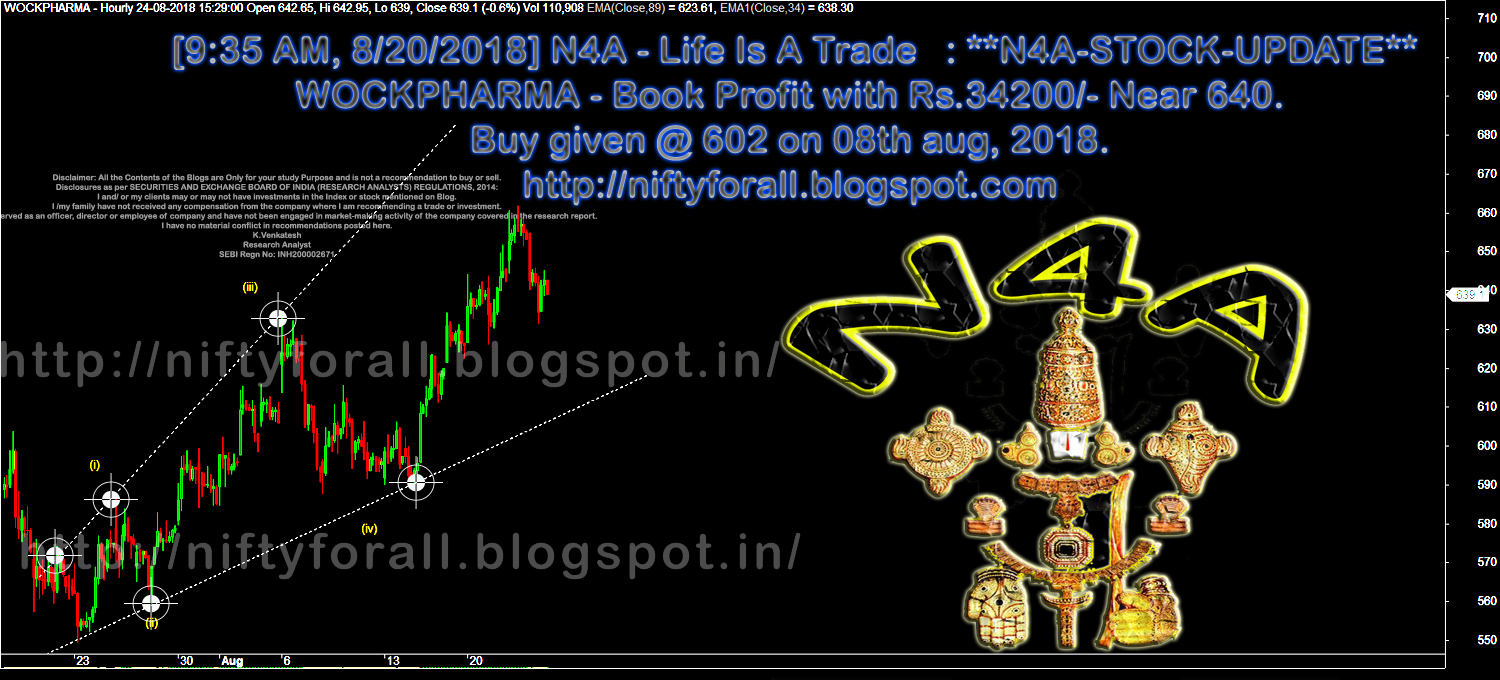
>>> WOCKPHARMA - Hourly Chart - Booked Profit Rs.34,200/- <<<

>>> Click the chart to see on full screen <<<

WockPharma - Booked Profit Rs.34200/- No Holdings. If manages to Hold 340 above - may Test 370 Soon.

>>> BHEL - Daily Chart - Posted on 20th August, 2018 <<<

>>> Click the chart to see on full screen <<<

Wrote - We are LONG and Above 77 More rally to come.

>>> BHEL - Daily Chart - Booked Profit Rs.37500/- <<<

>>> Click the chart to see on full screen <<<

Booked Profit with Rs.37500/- No Holdings. Support 79 If Holds may test 84 & 88 Soon.

>>> MCLEODRUSS - Investment Idea - HOLDING Long <<<

>>> Click the chart to see on full screen <<<

Holding for a Good Return.

>>> Performance till 24th August 2018 <<<

>>> Click the chart to see on full screen <<<

Above performance is not a Promise or guarantee for the given Profits or Loss.Performance given based on 1 lot at a time and clients Profit differ as per the margin availability and Number of Lots taken by them. We may or may not re-enter the Calls given here hit Stop Loss, as per market movement. The charts given above are just for educational purpose only and we don't recommend any Entry / Buy or Exit / Sell. Reader must taken their own decision or consult their qualified Analyst before making any decision.

>>> N4A & Whatsapp <<<


Wednesday, August 22, 2018

Resistance @ 11580 & 11630

Dear All,

>>> Nifty Hourly Chart <<<

>>> Click the chart to see on full screen <<<

Above 11580 may test 11630

>>> Bank Nifty Hourly Chart <<<

>>> Click the chart to see on full screen <<<

Support @ 28150 - 28080 - 28040.


>>> NIFTY - IT Weekly Chart <<<

>>> Click the chart to see on full screen <<<

Expect more rally on IT Stocks and Index. Cheers!!!

>>> N4A & Whatsapp <<<

Sunday, August 19, 2018

Weekly Review 20th August 2018

Dear All,


>>> Nifty Daily Chart <<<

>>> Click the chart to see on full screen <<<

Channel Resistance & 11495 & 11540. Break above 11540 may give more rally.

>>> Nifty Hourly Chart - Posted on 11th August. 2018 <<<

>>> Click the chart to see on full screen <<<

Have mentioned on Last Weekly Review - Price if breaks below 11410 may test 11340. As mentioned Price took support @ 11340 and started rallying.

>>> Nifty Hourly Chart <<<

>>> Click the chart to see on full screen <<<

If can't Break above 11495 may invite Selling, may test support @ 11440 - 11420 - 11400 - 11340 - 11300. Above 11495 may test 11540.

>>> Bank Nifty Hourly Chart - Posted on Last Weekly Review <<<

>>> Click the chart to see on full screen <<<

After breaking support @ 28040 - tested 27740.

>>>> Bank Nifty Hourly Chart <<<<

>>> Click the chart to see on full screen <<<

Watch Resistance @ 28180 & 28240. Support @ 28080 - 27940 for Movement next week.

>>> WOCKPHARMA -Hourly Chart - Posted on Last Weekly Review <<<

>>> Click the chart to see on full screen <<<

Posted - We are LONG in WockPharma. See what happened.

>>> WockPharma - Hourly Chart - More Rally coming <<<

>>> Click the chart to see on full screen <<<

Watch 634 & 640 for a More rally.

>>> TATAMOTORS - Hourly Chart - Posted on Whatsapp on Friday <<<

>>> Click the chart to see on full screen <<<

Send on Whatsapp - WE are LONG. See Whats Next ?

>>> TATAMOTORS - Daily Chart - More Rally Coming <<<

>>> Click the chart to see on full screen <<<

Above 264 & 270 - Fresh Short Covering Rally Coming. HOLD Long.

>>> N4A & Whatsapp <<<

Wednesday, August 15, 2018

Resistance @ 11440 - 11460

Dear All,

>>> NIFTY Hourly Chart <<<

>>> Click the chart to see on full screen <<<

Resistance 11440 - 11460 if not crossed may test 11390 - 11340 - 11300.

>>> Bank Nifty Hourly Chart <<<

>>> Click the chart to see on full screen <<<

If given Resistance is not crossed above, may test the support given on chart. Cheers!!!

>>> N4A & Whatsapp <<<

Sunday, August 12, 2018

Weekly Review - 13th August 2018


Dear All,

>>> Nifty Hourly Chart <<<

>>>Click the chart to see on full screen <<<

Weak global ques if breaks support @ 11410 & 11390 > May test 11340 & 11300

>>> Bank Nifty Hourly Chart <<<

>>>Click the chart to see on full screen <<<

Any gap down opening on monday must hold 28040. If breaks may test 27900 & 27830

>>> NIfty Metal Index - Daily Chart <<<

>>>Click the chart to see on full screen <<<

Trump's Taxing on major Steel Exporting nations - might have a big impact on Steel industy around the world. 3510 if breaks may bring a 100 point rally. Fail to cross above may trigger a good correction. Caution on all steel stocks.

>>> Nifty - Reality - Index - Daily Chart <<<

>>>Click the chart to see on full screen <<<

For the Last 6 months - Reality Index and Stocks are witnessing a Deep correction or consolidation. Now the Index if crosses above 275 - may trigger some value buying on entire stocks. Fails to cross above may see some consolidation till 265 or 260.

>>> WOCKPHARMA - Hourly Chart - Holding LONG <<<

>>>Click the chart to see on full screen <<<

Holding LONG with a SL, May re-enter also, if SL hit as per movement.

>>> SBIN - Hourly Chart - Exited & No Holdings <<<

>>>Click the chart to see on full screen <<<

No Holdings. Support @ 300 & 297 if Holds may revive.

>>> Nifty MidCap50 - Hourly Chart <<<

>>>Click the chart to see on full screen <<<

Above 5080 More Rally. Watch Mid Cap Stocks for action Next week.

>>> Performance till 10th August, 2018 <<<

>>>Click the image to see on full screen <<<

Above performance is not a Promise or guarantee for the given Profits or Loss.Performance given based on 1 lot at a time and clients Profit differ as per the margin availability and Number of Lots taken by them. We may or may not re-enter the Calls given here hit Stop Loss, as per market movement. The charts given above are just for educational purpose only and we don't recommend any Entry / Buy or Exit / Sell. Reader must taken their own decision or consult their qualified Analyst before making any decision.

>>> N4A & Whatsapp <<<


Thursday, August 09, 2018

Next Resistance @ 11520

Dear All,

>>> Nifty Hourly Chart <<<

>>> Click the chart to see on full screen <<<

May Test 11520 & 11590 If manages to Trade above 11460

>>> N4A & Whatsapp <<<