>>> Nifty Chart - Weekly <<<
>>> Click the chart to see on full screen <<<
Three day trading last week - gave a red doji. May be a warning from Bear, but we still need more confirmation for a meaningful correction.
>>> Nifty Chart - Daily <<<
>>> Click the chart to see on full screen <<<
8350 or 38.2% retrace looks important for Bulls. Both and Price and RSI must cross above for a next bullish upmove.
>>> Nifty Chart - Hourly <<<
>>> Click the chart to see on full screen <<<
Lets wait for the next move.
>>> Bank Nifty - Daily Chart <<<
>>> Click the chart to see on full screen <<<
38.2% retraced like Nifty and hit the resistance at 17360 with a Red colured Dragon Fly Doji. So we need confirmation this week for a clear decision.
>>> Last Week - Updates <<<
>>> Arvind - As posted on 06th Nov, 2014 <<<
>>> Click the chart to see on full screen <<<
Wrote - Arvind was on a IHS break out.
>>> Arvind - Happened <<<
>>> Click the chart to see on full screen <<<
Yes - We exited Long.
>>> ACC - As Updated on 03rd Nov, 2014 <<<
>>> Click the chart to see on full screen <<<
Wrote - ACC is set for a fall.
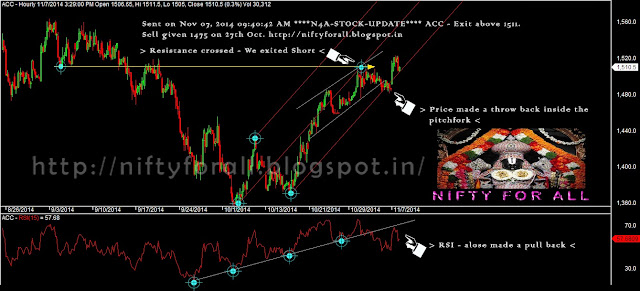
>>> ACC - Happened <<<
>>> Click the chart to see on full screen <<<
Break down failed and Exited short with loss.
>>> Performance till 07th Nov, 2014 <<<
>>> Click the image to see on full screen <<<
Send your email to niftyforall@yahoo.com for more details.


