
A smart rally on the Budget day pushed the market to end the week higher with Nifty reclaiming its crucial 8,700 mark, however, the cautious sentiment ahead of the Reserve Bank of India’s policy meeting and visa woes on the IT sector kept the momentum slow.
Budget 2017
‘No bad news is good news’ is what sums up best Budget 2017 for stock market. The Finance Minister Arun Jaitley refraining from tweaking long-term capital gains (LTCG) soothed investors’ nerves, while sector specific budgetary stimulus such as according infrastructure status to affordable housing, relief on LTCG on immovable property, plans to create a mega oil firm along with setting up a comfortable fiscal deficit target of 3.2% for FY18 boosted market spirit.
Global cues
An eventful week back home overshadowed the significant global developments that played quietly in the stock market. The US Federal Reserve kept interest rates unchanged, while Bank of Japan also maintained status quo in their respective policy meetings. Bank of England also said they are in no rush for rate hikes. They repeated that they could tolerate some overshoot of their inflation target, but only within limits. Meanwhile, People's Bank of China unexpectedly raised the interest rates on open market operations, adding to growing concerns about US President Donald Trump's aggressive policies.
MARKET NEXT WEEK:
The investors will took cues from the strong US jobs growth data which pushed the Wall Street higher on Friday. Index of Industrial Production (IIP) data due on Tuesday and Reserve Bank of India’s policy meeting scheduled for Wednesday will also be under investors’ radar.
>>> Nifty Daily Chart <<<

>>> Click the chart to see on full screen <<<
Two Resistance as given on Chart - Might be end of Bulls wave. 8770 or 8990 might stop the bulls from moving further.
>>> Nifty Hourly Chart <<<

>>> Click the chart to see on full screen <<<
Above 8750 - Price may test 8885-8890 any time.
>>> Nifty Bank - Daily Chart <<<

>>> Click the chart to see on full screen <<<
Price made a Break out for Wave X.
>>> Nifty Bank - Hourly Chart <<<

>>> Click the chart to see on full screen <<<
20500 - looks possible as per above chart, If not wrong.
>>> CNX-IT - Posted on 02th Feb, 2017 <<<

>>> Click the chart to see on full screen <<<
Wrote on 02nd Feb, 2017 for a Possible reversal.
>>> CNX-IT - Holding Long - More Rally Possible <<<
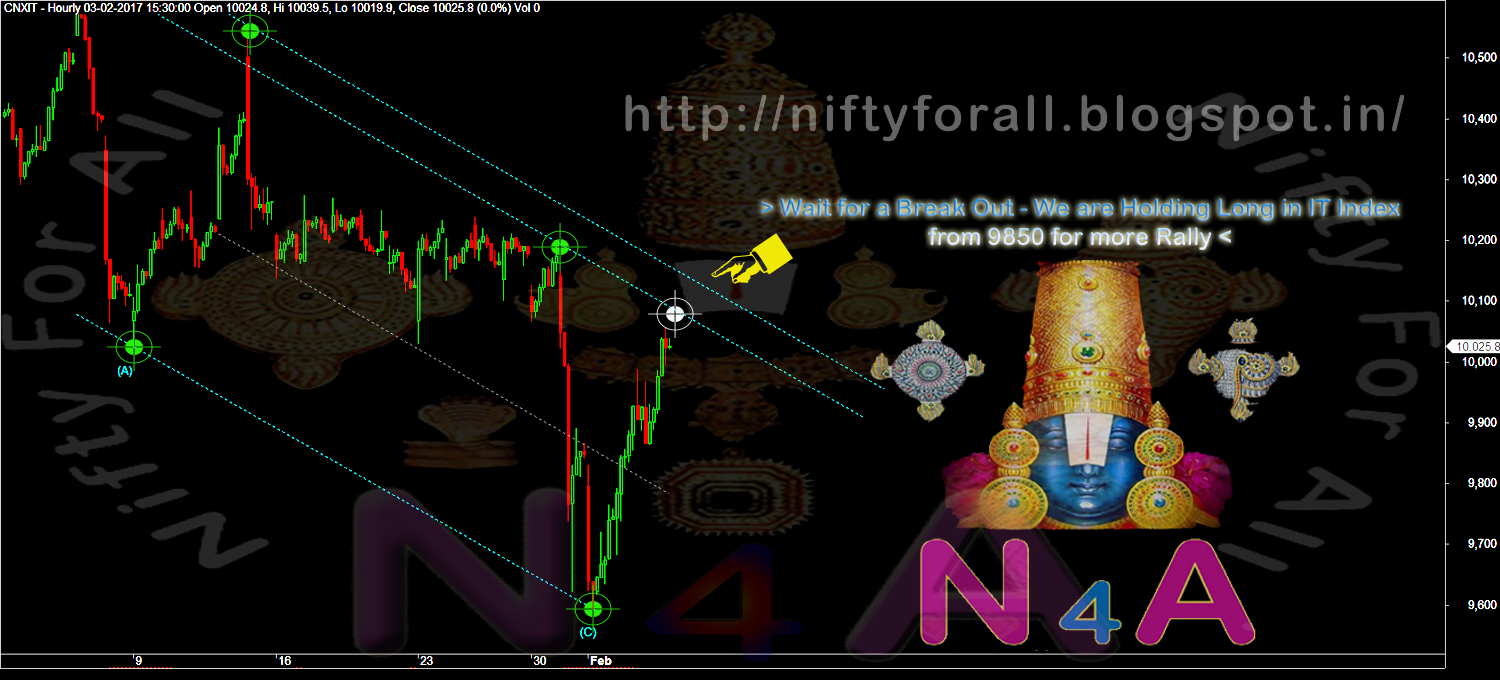
>>> Click the chart to see on full screen <<<
Holding Long - If breaks out - Expect more Rally.
>>> BIOCON - Posted Last Weekly Review <<<

>>> Click the chart to see on full screen <<<
Earlier - On last Weekly Review - Mentioned Biocon - might have topped out. We have entered Short also - See what happened.
>>> BIOCON - Profit Booked @ 998 & Exited <<<

>>> Click the chart to see on full screen <<<
We Booked our Profit on Biocon Short - as the Last leg getting extended. Based on chart - we may or may not - re-enter short again as per Price movement.
>>> AdaniPort - Booked Profit on 31st Jan, 2017 <<<

>>> Click the chart to see on full screen <<<
Earlier on 31st Jan, We Booked Profit Rs.25000/- and Exited.
>>> AdaniPort - Re-Entered Short for a Good Correction <<<

>>> Click the chart to see on full screen <<<
Re-Entered Short - A Raising Wedge Like Pattern - Possibly may break - for a Wave C Fall any time.
>>> Divis Lab - Posted on 02nd Feb, 2017 <<<

>>> Click the chart to see on full screen <<<
Wrote - Price may give more rally.
>>> Divis Lab - Booked Profit Rs.30,000/- Near 750 <<<

>>> Click the chart to see on full screen <<<
More rally Possible - As Stocks looks like - Bottomed out. We have advised less risky traders to take profit Rs.30,000/- near 750.
>>> MindTree - Carry Long - Posted on 01st Feb, 2017 <<<

>>> Click the chart to see on full screen <<<
We are holding long for more rally from 450.
>>> N4A - Services <<<

Send your Service queries to niftyforall@yahoo.com or whatsapp @ 9677924975
>>> Performance for the month end of Jan, 2017 <<<

>>> Click the image to see on full screen <<<
Above performance is not a Pomise or guarantee for the given Profits or Loss.Performance given based on 1 lot at a time and clients Profit differ as per the margin availability and Number of Lots taken by them. We may or may not re-enter the Calls given here hit Stop Loss, as per market movement. The charts given above are just for educational purpose only and we don't recommend any Entry / Buy or Exit / Sell. Reader must taken their own decision or consult their qualified Analyst before making any decision