Dear All,
>>> Key to Successful Investment Strategy :-
The key to any successful investment strategy is knowing the delicate balance between your comfort level and risk against a specified time horizon.
1. Accept responsibility :-
Was the last bad trade one of your single biggest losses? Was it your first ever significant financial loss? If so, be sure to own it. Losses are part of any investment strategy. It happens to the best investors.
Don’t simply brush it aside. Learn from it. Don’t continue investing until you have. Know what happened and don’t simply blame market volatility for your loss. Take ownership of what happened.
Honestly assessing your actions and determining the consequences of those actions will allow you to make better future decisions. Despite the difficulty of trying to counter how this loss will impact you, learn from it. This will allow you to control your investment trading. It will also keep single losses from turning into a massive losing streak.
2. Stop trading :-
When a bad trade happens, especially one that has significant impact, stop trading. Seriously. The mechanisms of our ego defense system will immediately use emotion to try and recoup your loss. Trying to find a better trade when you’re emotionally invested will just lead to further losses.
Instead, walk away from trading. Find a way to work out your frustrations. For some, that may be going for a run, and for others a yoga class. Find the method that best allows you to remove negative emotions from your environment.
Stop all trades for a few days. Rather conduct simulated trades to allow yourself to get back into strategic investing. This will clear any psychological and emotional hurdles the last bad trade may have left behind.
3. Refocus :-
When you have rid yourself of negative emotions, use the bad trade as motivation. Return small when resuming live trading to make sure you do not allow emotions to dictate an attempt to recoup your losses.
A professional approach is to resume trading to get you back to the level of success you were at before your bad trading day. Refocusing after a bad loss means regaining your investment strategy again to start acquiring safe, steady gains.
4. Have a plan :-
After finding your focus and building up your confidence, make a detailed action plan for future trades. This will allow you to understand what went wrong. Establish limits within your detailed action plan. As most bad trades could be quantifiable because of key market actions, identify the factors within your bad trade that could be quantified for profitable gains.
A bad trade should be used as a catalyst to improve your trading strategy.
5. Put your loss into perspective :-
Seasoned traders understand that losses are part of a trader’s routine. Bear markets are normal, but so are bull markets. Inexperienced traders may try to trade through the embarrassment and pain of a bad trade.
It’s important to put this loss into a perspective. Remember that a bad trade is simply that, a bad trade. It’s moments like this that self-reflection are important. Bad trading days are also a good time to remind you of the successes you’ve had through both bull and bear markets.
Much like other aspects of daily life, there’s a lesson in financial losses. A bad trade may be the economic loss you need as a trader to thrive into new opportunities.
No trade is without its risks. The potential of a trade is determined by quantifiable key market actions. Regardless of this, loss will occur. It’s how you learn and develop from that loss that will determine your success as a trader.
>>> Week Ahead <<<
Auto Sales :-
With December arriving next week, the focus could shift to auto sales. The market will look forward to the numbers as this will not include the festive season sales, which had been one of the key drivers in the past two months.
Going forward, the Street will take cues from these figures in a bid to gauge the consumption trends in the country as well. Auto stocks could be in focus. The sectoral index has been trading flat so far in November, while on a yearly basis, this has seen 22 percent increase.
S&P rating :-
The Street could react to the unchanged rating by global ratings agency S&P as it was factoring in either a status quo or an upgrade. It will also watch out for commentary on the Narendra Modi government’s efforts at the macro-economic level.
Macro data :-
On the domestic front, the Street will look forward to the quarterly GDP data figures for India, which will be declared on November 30.
Over and above this, the manufacturing purchasing managers’ index will be out during the next week, which will help in gauging the manufacturing activity in the country. Positive cues from these data points could help the Street push up to fresh bullish points.
US’ GDP data in the US, CPI data, crude oil imports, and manufacturing PMI could also keep the Street on its feet.
FII data :-
Foreign institutional investors (FIIs) sold shares worth Rs 416.28 crore compared to domestic institutional investors who bought Rs 427.63 crore worth of shares in the Indian equity market on Friday, data available with the NSE showed.
So far, for the month of November, FIIs have remained net sellers of Rs 10,742.22 crore worth of shares, while DIIs have purchased Rs 7,628.32 crore worth of shares, hinting at the continued support offered by domestic investors.
The Street will watch out for these flows, going forward, especially amid volatility ahead of F&O expiry and US Federal Reserve’s meet lined up next month.
F&O expiry :-
All futures and options contracts for November will expire on Thursday and positions will be rolled over to December.
ICICI Securities believes that the Nifty has been forming a base near 10,300 for the November series. The upmove can be extended till 10,600.
“Call positions are getting added at the 10,600 strike, which remains the target for the index. Closure was seen in the Nifty and Nifty Bank futures, which shows the short covering pattern seen in these indices,” the brokerage said in its report.
>>> Nifty Daily Chart <<<
>>> Click the chart to see on full screen <<<
In January 2007, S&P had changed India’s rating to BBB-, which is the lowest investment grade rating for bonds. The outlook that it assigned back then was “stable” which it later changed to negative in 2009 and again raised it to stable in 2010, it lauded the Modi government's fiscal consolidation drive and said that the reforms undertaken are favourable for the economy. After Moody's Upgrade - it was widely expected that S&P may too upgrade India's Rating. So fluctuations on Bonds and INR Possible - may reflect Equity too.
Resistance @ 10400 - 10495 - 10590. Support @ 10360 - 10330 - 10300.
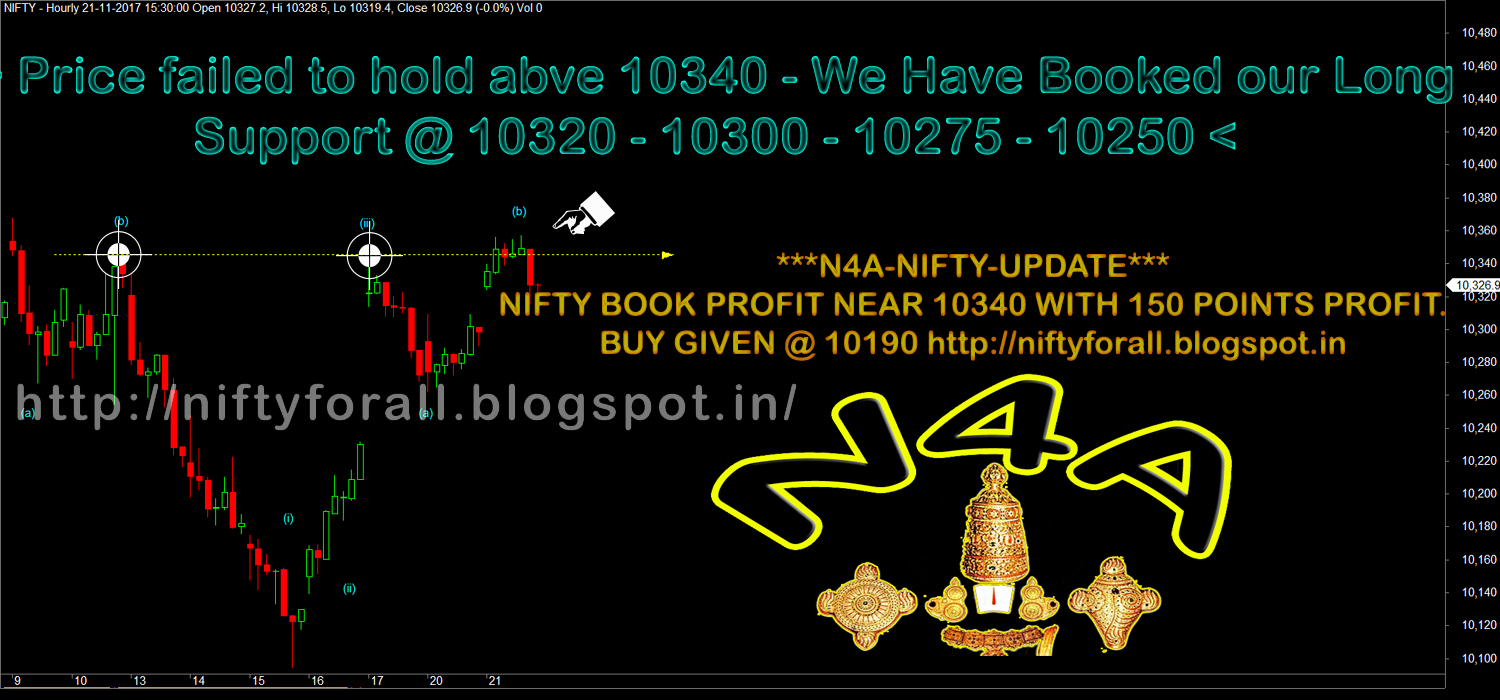
>>> Nifty Hourly Chart <<<
>>> Click the chart to see on full screen <<<
Crucial Resistance between 10405-415 - If doesn't breaks - may trigger a good correction.
>>> Bank Nifty Daily Chart <<<
>>> Click the chart to see on full screen <<<
ON the upper side Price retraced almost 150% may test or resist @ 25960. If so, Expect a good correction.
>>> Bank Nifty Hourly Chart <<<
>>> Click the chart to see on full screen <<<
25960 > Above more Rally.
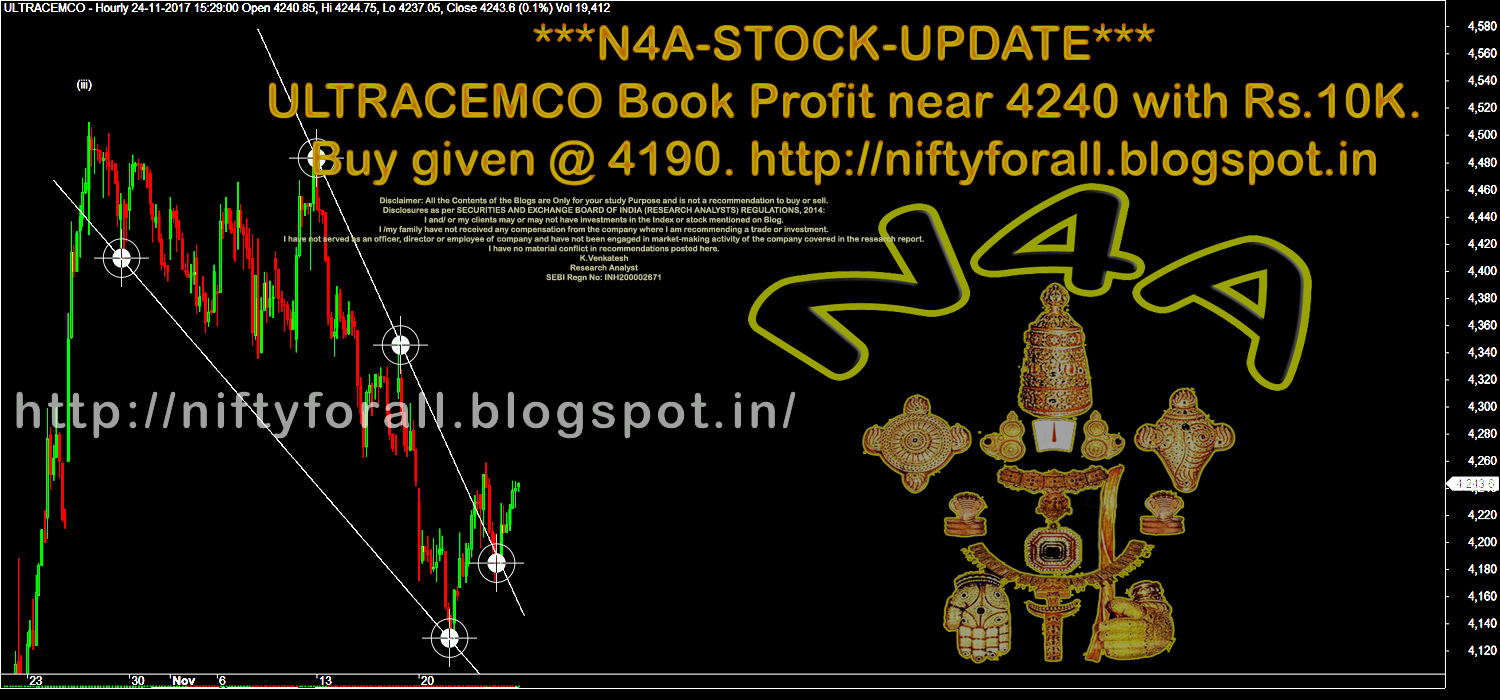
>>> ULTRACEMCO - Posted on 22nd Nov, 2017 <<<
>>> Click the chart to see on full screen <<<
Posted on 22nd Nov, We are Long.
>>> ULTRACEMCO - Booked Profit Rs.10,000/- <<<
>>> Click the chart to see on full screen <<<
Booked Profit Rs.10k.
>>> CNXPSUBank - Hourly Chart <<<
>>> Click the chart to see on full screen <<<
3950 if breaks - Expect Free Fall on all PSU Bank Stocks.
>>> NiftyMidCap50 - Hourly Chart <<<
>>> Click the chart to see on full screen <<<
Support @ 5175 & 5130. Resistance @ 5230 & 5300.
>>> CNXPharma - Hourly Chart <<<
>>> Click the chart to see on full screen <<<
Possible correction if fails to break above 9380 & 9420.
>>> SunPharma - Hourly Chart - Booked Profit Rs.20,000/- <<<
>>> Click the chart to see on full screen <<<
Booked Profit Rs.20,000/-
>>>> N4A - WhatsApp <<<
Send request with name and Location. Existing clients - If not receiving any messages - Must save my number or Ping Back. Cheers!!!