Pages

Thursday, October 30, 2014

Gold - Update - 30.10.2014

Dear All,

>>> Gold - As Updated on 29th Oct, 2014 <<<

>>> Click the chart to see on full screen <<<

As mentioned on above chart - All support broken and fell down. Now Whats next - Lets See.

>>> Gold - Update - Happened and Yet to <<<

>>> Click the chart to see on full screen <<<

26560 Looks as a good Support. Price fell down as a-b-c and C wave completed its 1-5 fall as marked on chart. Now Expect a good bounce from here if 26560 holds. Cheers!!!

8180 - Is this a Double Top ???

Dear All,

>>> Nifty - As Posted Yesterday <<<

>>> Click the chart to see on full screen <<<

Wrote Yesterday - channel acts as a resistance. Today the channel crossed and rallied till 8180. We hit Stop Loss. So lets see whats next.

>>> Nifty - Happened and Yet to <<<

>>> Click the chart to see on full screen <<<

8180 looks like a double top, But if cross above 8180, some more upmove possible. So lets wait and see.

>>> Bank Nifty <<<

>>> Click the chart to see on full screen <<<

RSI and MACD trying to give a Buy signal today. Should take care of that. If all happens with trend line break out on price, then rally to continue. Lets See. Cheers!!!

Wednesday, October 29, 2014

Crude Oil - Buy Triggered. Just Buy near 5080

Dear All,

>>> Click the chart to see on full screen <<<

Crude Oil - Buy Triggered. Just Buy near 5080. SL 4900. Good Rally coming.

Gold - Update - Fed Decision to Impact - 29.10.2014

Dear All,

>>> Click the chart to see on full screen <<<

Fed Impact may give a heavy volatile on Gold. Caution.

Trend Line Resistance 8115

Dear All,

>>> click the chart to see on full screen <<<

Upmove still On. But Indicators still on negative side. Above Expanding Triangle on chart suggest caution still. FED to Decide the next course of move.


>>> Apollo Tyre - As Posted Yesterday <<<

>>> click the chart to see on full screen <<<

Yesterday wrote - Price facing a resistance from a trend line, See what happened.

>>> Apollo Tyre - Happened and Yet to <<<

>>> click the chart to see on full screen <<<

As expected - Price resisted and still we need the price to break below the pitchfork for a good sell off.

>>> Bank of India <<<

>>> click the chart to see on full screen <<<

I hope the above chart is clear for you to understand that the BEAR is trying to make an entry in to the script. A Hanging man followed by a doji is a clear bear sign. But in case the price can move above the trend line - Upmove to continue. Else Heavy sell off may happen. Stay Cautious on Longs. Cheers!!!

Tuesday, October 28, 2014

Resistance @ 8035

Dear All,

>>> Click the chart to view on full screen <<<

Market made a pull back and resisted @ 8035. If able to cross and hold above 8035 and 8080 then rally may continue. Apart from technicals - Fed Decision today - should give a clear direction. Break below 7975 and 7935 should trigger a good fall. Lets Wait and See.

>>> Apollo Tyres - As Updated Last Weekly Review <<<

>>> Click the chart to view on full screen <<<

Wrote - Apollo Tyre on Bearish side.

>>> Apollo Tyre - Happened and Yet to <<<

>>> Click the chart to view on full screen <<<

We book a Part profit today. Late Trade had a spike which took support from the channel bottom as shown on chart. Now 222 should act as a key resistance.

>>> ACC <<<

>>> Click the chart to view on full screen <<<

After making a V shape recovery - Stocks having a resistance at 1480-1482 level. If the channel gets break then expect a good sell off. Cheers!!!

Monday, October 27, 2014

Support @ 7975 & 7935

Dear All,

>>> click the chart to see on full screen <<<

Broken the wedge. Now Supports 7975, 7935 and 7895 - Unable to hold, Expect more fall.

>>> Bank Nifty <<<

>>> click the chart to see on full screen <<<

Lets wait for the channel to get break for a fall. Else may take an one more upmove.

Friday, October 24, 2014

Weekly Review 27.10.2014

Dear All,

>>> Nifty - Daily - As posted last weekly review <<<

>>> Click the chart to see on full screen <<<

Wrote Last week the importance of 100dma & Support - 1 for bulls. See what happened.

>>> Nifty - Daily - Happened and Yet to <<<

>>> Click the chart to see on full screen <<<

As expected relief rally happened last week. Though We don't expect it to continue, as it can be a throw back. So lets see in details what's next on hourly chart.

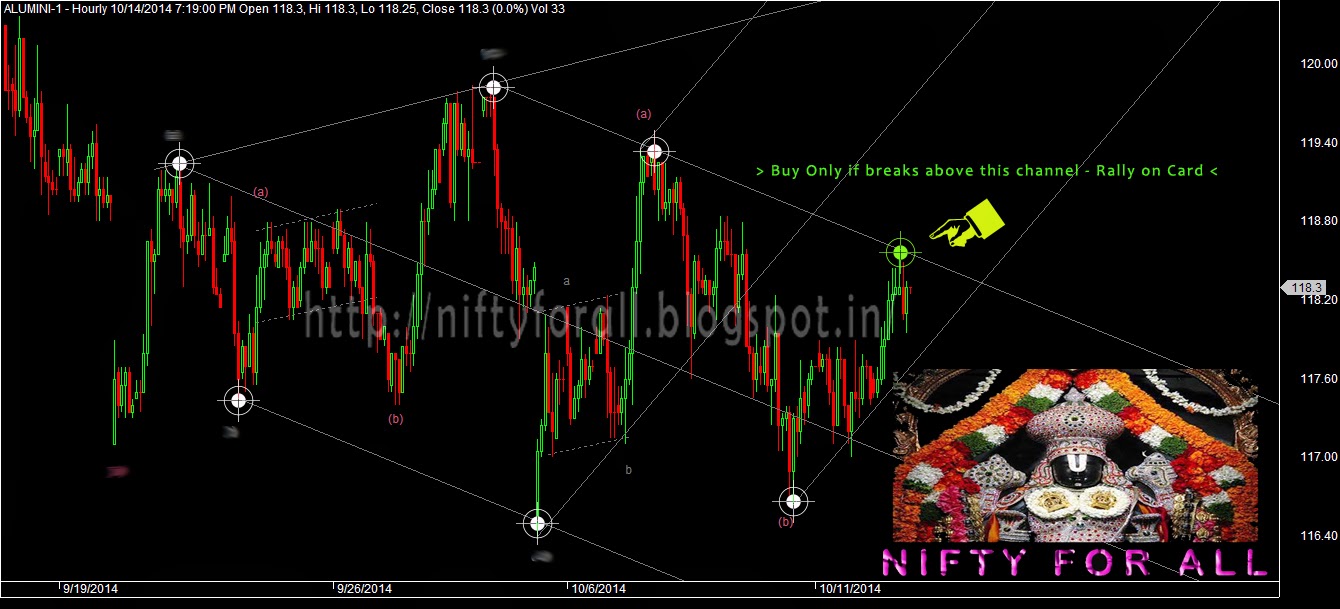
>>> Nifty - Hourly - As posted last weekly review <<<

>>> Click the chart to see on full screen <<<

Wrote Last weekly Review - If the Wedge bottom holds then expect a rally as given on chart. See what happened.

>>> Nifty - Hourly - Happened and Yet to <<<

>>> Click the chart to see on full screen <<<

Yes, All our Target Achieved and made a high of 8030. So now 8030 looks as a strong resistance. If unable to cross above and break below the raising wedge may trigger a sell off. Caution advised. Yes we have shorted too.

>>> Bank Nifty - As Posted Last Weekly Review <<<

>>> Click the chart to see on full screen <<<

Last week wrote - Relief rally ON since price was above 100 dma. As said rally continues and lets see whats next ???

>>> Bank Nifty - Happened and Yet to <<<

>>> Click the chart to see on full screen <<<

Bulls need to cross the Resistance Trend line as shown on chart to move further Up. But the present rally should be a throw back rally, as it already broken the trend line. If this chart is not wrong, then expect some fast sell off in coming days. Yes we are in short mode in bank nifty also. Lets See.

>>> Bank Nifty - Hourly - As Posted on Last Weekly Review <<<

>>> Click the chart to see on full screen <<<

Wrote Last Week - Bank Nifty was a Break out Candidate. See what happened.

>>> Bank Nifty - Hourly - As Posted on 20th Oct, 2014 <<<

>>> Click the chart to see on full screen <<<

Yes we made 390 Points and wrote about next resistance too. See what happened.

>>> Bank Nifty - Hourly - Happened and Yet to <<<

>>> Click the chart to see on full screen <<<

Resisted at 161.8% - If unable to cross above then expect a fall. Just Sell. We are in Short on Bank Nifty also.

>>> Last Week Chart Performance <<<

>>> Tata Power - As Posted Last Weekly Review <<<

>>> Click the chart to see on full screen <<<

Wrote last week to Buy Tata Power - See what happened.

>>> Tata Power - happened <<<

>>> Click the chart to see on full screen <<<

Earlier we had an exit with a loss of Rs.16000 (ref Performance Sheet), has been recovered by the second entry with a profit of Rs.20,000. Now 87 SL looks important and there is a minor break down. Lets See.

>>> Arvind - As Posted on 21st Oct, 2014 <<<

>>> Click the chart to see on full screen <<<


We are long since 281. See what happened.

>>> Arvind - Happened <<<

>>> Click the chart to see on full screen <<<

Yes We booked 34000 Profit near 298.

>>> Performance <<<

>>> Click the chart to see on full screen <<<

Send email to niftyforall@yahoo.com for details.

>>> Stock of the Week - Apollo Tyre <<<

>>> Click the chart to see on full screen <<<

Just Sell and Earn

Tuesday, October 21, 2014

Resistance @ 7934

Dear All,

>>> click the chart to see on full screen <<<

Resistance @ 7934, if unable to cross then may test the given support. Else upmove to continue.

>>> Tata Power <<<

>>> click the chart to see on full screen <<<

Last weekly Review - Have given Tata Power. Earlier we exited with a loss and re-entered and made a profit of Rs.20,000/-. Stocks still looking good for a rally.

>>> ARVIND <<<

>>> click the chart to see on full screen <<<

We are long since 281 from Yesterday. Today stock made a high of 296 - almost near to our First Target. We had a Part Profit of Rs.20,000/-. More Rally coming. Cheers!!!

Monday, October 20, 2014

Aluminium - Target Achieved - Book Profit

Dear All,

>>> Aluminium - As Posted on 14th Oct, 2014 <<<

>>> click the chart to view on full screen <<<

Wrote on 14th Oct to Buy Aluminium at 118. See what happened.

>>> Aluminium - Happened <<<

>>> click the chart to view on full screen <<<

Almost hit 121 today. Book Profit.

Copper - Get Ready to Buy near 402

Dear All,

>>> Click the chart to see on full screen <<<

Copper - Buy near 402. cmp: 406. Keep Support 392-394 as SL. Cheers!!!

Resisted @ 7898

Dear All,

Nifty Hourly - As Posted on Last Weekly Review <<<

>>> click the chart to see on full screen <<<

Wrote on last weekly review - about a wedge break out and possible Target. See what happened today !!!

>>> Nifty - Hourly - Happened and Yet to <<<

>>> click the chart to see on full screen <<<

Second Target @ 7898 done. Lets look for next 2 levels also.

>>> Bank Nifty - As Posted on Last Weekly Review <<<

>>> click the chart to see on full screen <<<

Wrote - we are long in Bank Nifty - See what happened today.

>>> Bank Nifty - Happened <<<

>>> click the chart to see on full screen <<<

Almost 390 Points Profit on a gap up opening. So lets wait and see what happens about the next resistance. Cheers!!!

Sunday, October 19, 2014

Weekly Review - 13.10.2014

Dear All,

>>> Nifty Daily - Chart <<<

>>> Click the chart to see on full screen <<<

Price holding 100dma, inside the Wedge, above 7750, So expect relief rally. So whats the target???, Lets see it on Hourly chart in detail.

>>> Nifty Hourly - Chart <<<

>>> Click the chart to see on full screen <<<

Yes Nifty heading towards 7830, 7900 and 7950, But price should hold the wedge bottom as shown on chart.

>>> Bank Nifty - Daily - Chart <<<

>>> Click the chart to see on full screen <<<

Broken the trend line, hence trend remain down, and presently trading above 100dma. So a relief (pull back) rally possible. Lets see what's next. Lets see it on Hourly chart.

>>> Bank Nifty - Hourly - Chart <<<

>>> Click the chart to see on full screen <<<

Yes 16000 and 16150 on card. And also we are long in Bank Nifty too.

Weekly Stock Pick :-

>>> Tata Power <<<

>>> Click the chart to see on full screen <<<

Tata Power broken out of the falling wedge. MACD on a positive divergence. Just Buy for rally.

>>> Performance <<<

>>> Click the chart to see on full screen <<<

Email to us on niftyforall@yahoo.com for details.

Thursday, October 16, 2014

Support @ 7730

Dear All,

>>> Click the chart to see on full screen <<<

Finally 7730 Should give support at the end of falling edge. Also 100dma to be watched. Lets See.!!!

Tuesday, October 14, 2014