>>> Nifty - Daily Chart <<<

>>> Click the chart to see on full screen <<<
Daily chart looks like relief rally - hence the fall marked as wave (a) or (4). So to make it confirm about the rally to continue - we need more confirmation - Lets see in detail on hourly chart.
FII's started buying since last week - indicates the rally may continue.
>>> Nifty - Hourly Chart <<<

>>> Click the chart to see on full screen <<<
Moving Average Crossed now. But still 7661 remains a hurdle. So lets wait and see.
>>> Bank Nifty <<<

>>> Click the chart to see on full screen <<<
Bank nifty - RSI on a break out mode. Price yet to give a break out.
>>> Last week Chart Performance <<<
>>> Rcom <<<
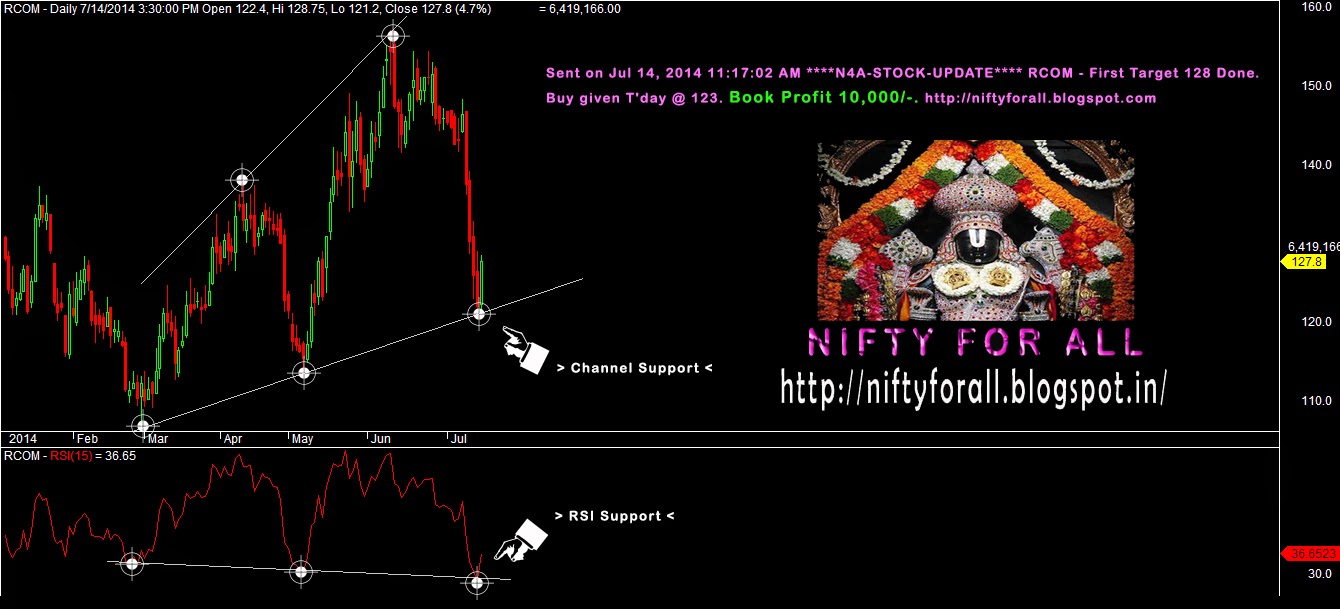
>>> Click the chart to see on full screen <<<
>>> Bank India <<<

>>> Click the chart to see on full screen <<<
>>> Andhra Bank <<<

>>> Click the chart to see on full screen <<<
>>> M&MFin <<<

>>> Click the chart to see on full screen <<<
>>> IDBI <<<

>>> Click the chart to see on full screen <<<
>>> Jindal Steel <<<

>>> Click the chart to see on full screen <<<
>>> Performance - till 18th July - 2014 <<<

>>> Click the image to see on full screen <<<
>>> L&T Finance Holding Ltd., - Special Coverage - Follow Up <<<
Reserve Bank of India’s recent move to ease infrastructure loans is a positive.
L&T Finance Holdings' Q1 results on July 23, 2014
>>> As Posted on 27th June - 2014 <<<

>>> Click the image to see on full screen <<<
Last time the bounce did not happen as expected and hit a low of 67. So lets see what the chart says now.
>>> What to Happen <<<

>>> Click the image to see on full screen <<<
RSI gave a clear break out - So we need a break our from Price above the channel - as shown on chart. If breaks then rally to continue. Cheers!!!