>>> Nifty Weekly Chart <<<
>>> Click the chart to see on full screen <<<
Above weekly Chart - Shows how the Candle Sticks played an important role so far. Bearish Doji on the top confirmed the fall, while a Hammer and Doji at the bottom of the chart near 8000 and 7960 made a base for the bulls.
But last week candle was a bearish engulfing, which closed below previous three candles and 50 Week moving average is a concern for the bulls now.
So next week is going to be decision making week for bulls and bears.
8000 and 7960 going to play a key role, if breaks below may give strength for bear and the fall may continue.
>>> Nifty Daily Chart <<<
>>> Click the chart to see on full screen <<<
An example chart given above, which was like a mirror on the daily chart - Shows that the Grave Stone doji near 161.8% retrace looks like a Bullish one. As mentioned on the chart, if the price closed below 8000 or 161.8% retrace, then the fall may continue.
>>> Nifty Hourly Chart <<<
>>> Click the chart to see on full screen <<<
On Hourly chart - Last 2 and half day fall had a Positive Divergence from RSI. A break below 8046 or 8060 may confirm the downtrend with more fall.
>>> Bank Nifty Weekly Chart <<<
>>> Click the chart to see on full screen <<<
It was on the RBI's Rate Cut changed the entire way of the market, Particularly Bank Nifty. Above Weekly Chart shown the Bearish Engulfing Candle - which closed below the previous three candle - shows the strength of the fall and Bear.
Now its the Channel Support and 50 Week Moving Average to decide the way and trend of the Bank nifty. Break below the Channel support and 50 WMA may confirm the fall further.
>>> Bank Nifty Daily Chart <<<
>>> Click the chart to see on full screen <<<
Price below 200 DMA. Last hope is the Channel and Previous Low 17250, if breaks, fall to continue. Else - As mentioned on chart, Price is moving for a 5th wave and Subwave (iii) must start for a good rally.
>>> Bank Nifty Hourly Chart <<<
>>> Click the chart to see on full screen <<<
Just like Nifty - Bank Nifty also had a positive divergence on RSI. Lets see how it react next week.
>>> Stock for the Week <<<
>>> BATA INDIA - As Posted on 03rd June, 2015 <<<
>>> Click the chart to see on full screen <<<
Wrote - Bata India - As our Holding. After making a rally towards 1045, stock reversed. See whats next !!!
>>> BATA INDIA - Happened <<<
>>> Click the chart to see on full screen <<<
Wave B forming an abcde pattern, If breaks below the given support, fall to continue, Else Price may bounce again.
>>> ACC - As Posted on 04th June, 2015 <<<
>>> Click the chart to see on full screen <<<
Wrote on 04th June, 2015 - about our long on the stock. But the Price did not moved up as expected. Lets see whats next !!!
>>> ACC - Happened <<<
>>> Click the chart to see on full screen <<<
Good Support @ 1420, breaks below, Fall may continue.
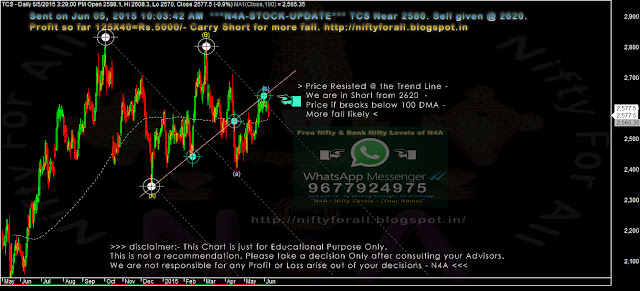
>>> TCS - Hourly Chart <<<
>>> Click the chart to see on full screen <<<
We are short on TCS from 2620, looking for a more fall. Cheers!!!


