Pages

Tuesday, March 31, 2015

Support @ 8443,8410,8376 & 8330. Remain Long.

Dear All,

The annual infrastructure output growth slowed to 1.4% in February, mainly dragged down by a contraction in the production of steel, fertilisers and refinery products, government data showed on Tuesday.

The output had expanded 1.8% year-on-year in January and in February 2014 it was 6.1%.

The cumulative growth of core sectors during April-February stood at 3.8%.

Natural gas, steel and crude production declined to 8.1%, 4.4% and 1.9 percent respectively, according to data release by the ministry of commerce and industry.

In cumulative terms it was natural gas that witnessed maximum fall in April-February at 5.5% followed by crude oil at 1.1%.

Only coal, cement and electricity increased during the month by 11.6%, 2.7% and 5.2% respectively.

The infrastructure sector, which comprises coal, crude oil, oil refining, natural gas, steel, cement, electricity and fertilisers, accounts for 37.9 percent of India's industrial output.

>>> Nifty Hourly Chart <<<

>>> Click the chart to see on full screen <<<

Price holding above the trend line. Immediate Supports must be 8443,8410,8376 and 8330. 50 and 100 HMA should be the key resistance along with 8594,8694 and 8794.

>>> Bank Nifty Hourly Chart <<<

>>> Click the chart to see on full screen <<<

Immediate Support as given on above chart, if holds then upmove to continue. Just remain Long till then.Cheers!!!

Monday, March 30, 2015

8470 Crossed. Next Resistance @ 8594 & 8694.

Dear All,

Markets took a U- turn today, on the back of strong buying in the frontline stocks. Short sellers were forced to cover their shorts helped the markets to a certain extent. Global markets were also in the green helped the sentiments to improve.

Credit rating agency Moody’s said in its latest Credit Outlook report released on Monday that the government’s latest plan to revive the stranded gas-based power generation capacity through imports will help save $16 billion worth of investments and banks including IDBI, State Bank of India (SBI) and ICICI are set to be the biggest beneficiaries of the plan.

"China' stocks surged to yet another year-to-date high on the back of market expectations that the PBoC might provide even more monetary policy stimulus with Governor Xiaochuan saying that 'China can have room to act'," said Rabobank strategist Piotr Matys.

Markets across eastern Europe joined the rally, with Polish and Hungarian indices adding around 1 percent, while in Russia both rouble- and dollar-denominated shares rose.

Most technical analysts are not reading too much into today's up move and sees it as more of a technical pull back rally, and till the time 8500-8520 levels on Nifty is not crossed comfortably, there is always a possibility of markets falling towards support levels.

>>> Nifty Hourly Chart - As Posted on Weekly Review <<<

>>> Click the chart to see on full screen <<<

As Per our Hourly chart given above on weekly Review - Key Resistance 8470, 8594 and 8694. See what happened today ??

>>> Nifty Hourly - Happened <<<

>>> Click the chart to see on full screen <<<

Crossed First Resistance 8470. So next Move towards 8594 and 8694.

>>> Bank Nifty Hourly Chart - As Posted on Weekly Review <<<

>>> Click the chart to see on full screen <<<

It was a clear message on weekly review that Bank Nifty on a break out mode for a good bounce. See what happened.

>>> Bank Nifty Hourly Chart - Happened <<<

>>> Click the chart to see on full screen <<<

As expected Bank Nifty too bounced strongly, So Just wait for next two targets as given on chart.

>>> ITC Hourly Chart <<<

>>> Click the chart to see on full screen <<<

Part Profit of Rs. 10,000/- so far, More rally possible. Cheers!!!

Saturday, March 28, 2015

Weekly Review - 30.03.2015

Dear All,

It was yet another week of losses as both the benchmarks Sensex and Nifty plunged 2.7-2.8 percent from last week’s closing levels.

Just as market was reconciling to the prospect of a rate hike in the US, air strikes on Yemeni rebels caused crude prices to surge. Investors are worried that continuing strife in the Middle East could push crude oil prices up further.

The coming week is a holiday-shortened one as the market will remain closed on Thursday, 2 April 2015, on account of Mahavir Jayanti and on Friday, 3 April 2015, on account of Good Friday.

Technically, intermediate trend of the Nifty Future in short term is down. However it is expected to see some retracement of the current fall, say experts.

Here are top events which is likely to impact the markets in the coming week:

HSBC India Manufacturing Purchasing Managers' Index (PMI) for March 2015 is due on Thursday, 2 April 2015. Prior to that, the government will unveil Eight Core Infrastructure Industries data for February 2015 on Tuesday, 31 March 2015. And, they'll also unveil fiscal deficit data for February 2015 on the same day, i.e. 31 March 2015.

Lets move on to TA.

>>> Nifty Daily Chart <<<

>>>Click the chart to see on full screen <<<

Exactly the Last hope for bulls at 8270. Break below 8270 may see 7826.

>>> Nifty Hourly Chart <<<

>>>Click the chart to see on full screen <<<

As per explanations given on chart.

>>> Bank Nifty Daily Chart <<<

>>>Click the chart to see on full screen <<<

Pipe formation near the channel shows Bounce ahead.

>>> Bank Nifty Hourly Chart <<<

>>>Click the chart to see on full screen <<<

Minor break out see on RSI and If Price continues to do the same, Expect some bounce from here.

>>> ITC <<<

>>>Click the chart to see on full screen <<<

Accumulate.

>>> UNION BANK <<<

>>>Click the chart to see on full screen <<<

Accumulate.

>>> Performance till 27th March, 2015 <<<

>>>Click the image to see on full screen <<<

Send your emails for niftyforall@yahoo.com for complete service details.

Thursday, March 26, 2015

Are you Still Bullish. Ok, then Buy.

Dear All,

>>> Nifty Daily Chart <<<

>>> Click the chart to see on full screen <<<

So whats happening on Market. Why Nifty fell down so drastically today on Expiry Day. Every one had a big question. So here is the answer for all your doubts and queries.
Above is a daily chart of Nifty. Wave C took nifty to a new high of 9119 on 04th March, 2015. Today Nifty made a low of 8326, almost a 793 Points fall in less than a month. Nifty cooled of heavily and touches the Trend line support today.

>>> Nifty Hourly Chart <<<

>>> Click the chart to see on full screen <<<

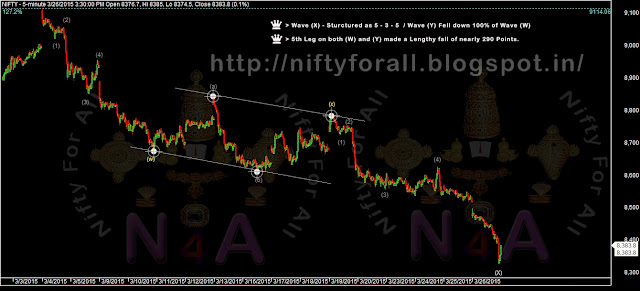
So the above hourly chart tell us how Wave (X) was defined. Made a Low of 8326 and filled the gap as shown above. Let's see more details on 5 mins chart.


>>> Nifty 5 Mins Chart <<<

>>> Click the chart to see on full screen <<<

5-3-5 was well explained on the above 5 mins chart. 5th wave on both (w) and (y) had a length of nearly 290 points. So overall figure tell us the Bulls are still healthy and alive. Lets wait and see.

>>> Bank Nifty Hourly Chart <<<

>>> Click the chart to see on full screen <<<

Nothing more to say about the above chart. Its an A-B-C and C wave made a 100% fall of Wave A. So what else left to say in this chart. Only 1 word left to say. BUY. Cheers!!!

Wednesday, March 25, 2015

Get Ready to Buy on Expiry Day ??? Will You !!!

Dear All,

>>> Nifty - 5 Mins Chart <<<

>>> Click the chart to see on full screen <<<

Almost nearing for a Buy. Cheers!!!

Tuesday, March 24, 2015

Resistance 8620 & 8645

Dear All,

>>> Nifty Hourly Chart <<<

>>> click the chart to see on full screen <<<
Key Resistance 8620 and 8645. As per above chart, Price on the last leg of fall. Hence 8620 or 8645 resisted the movement, may trigger a fall towards 8450.

>>> Bank Nifty - As Posted Yesterday <<<

>>> click the chart to see on full screen <<<
Yesterday - Wrote clearly 18430 as a support. See what happened today.

>>> Bank Nifty - Happened and Yet to <<<

>>> click the chart to see on full screen <<<
Below 18430, May test 17860 as shown on above chart. Cheers!!!

Monday, March 23, 2015

Support @ 8515 & 8450.

Dear All,

>>> click the chart to see on full screen <<<
A break below 8515 may see 8450.

>>> Bank Nifty <<<

>>> click the chart to see on full screen <<<
Support @ 18430 and 17860. Cheers!!!

Sunday, March 22, 2015

Weekly Review - 23.03.2015

Dear All,

Despite good news, the markets closed in the red for the second consecutive week and it looks like they are going through a reality check at the moment, analysts across brokerage firms say.

Early this month, the Reserve Bank of India surprised the Street with a rate cut, we witnessed the passage of the Insurance Bill and then we had the FOMC meeting outcome. But all failed to lift the markets.

The Indian markets are likely to remain volatile in the upcoming week as well ahead of the March month F&O expiry due on 26 March 2015. Analysts do not rule out further consolidation in the upcoming week.

If the index fails to decisively close above the 8600 level in the upcoming week, markets could see further decline up to levels of 8500 on the Nifty, and around 300 levels on the Sensex.

Meanwhile Indian Economy expected to clock a growth rate of 7.4 per cent in the current financial year, which is likely to improve further to 8.3 per cent by 2016-17, says an HSBC report.

According to HSBC, India's current account will be in surplus for the quarter ending March 2015 (after 32 consecutive quarters in deficit), and the deficit for the upcoming fiscal year will halve to 0.6 per cent of GDP from 1.1 per cent in the current fiscal year.

"If recovery and job creation are slow, the government could resort to fiscally irresponsible policies," HSBC said, adding that a rapid increase in commodity prices is a key risk and may "destabilise" the macro environment.

The global brokerage said the RBI would cut rates by another 25 bps by June, but cautioned that the space for more aggressive rate cuts is "constrained" by the RBI's explicit mandate to bring the inflation rate to the mid-point of the 4 per cent, +/-2 per cent band by early 2018.

The RBI is scheduled to announce its next bi-monthly policy statement on April 7.


>>> Weekly Chart - As Posted on Last Weekly Review <<<

>>> Click the chart to see on full chart <<<

As per our last weekly review - RSI Broken the Trend line, Price need to confirm by breaking the trend line.

>>> Weekly Chart - Happened and Yet to <<<

>>> Click the chart to see on full chart <<<

So the Price continue to fall after RSI break down. Though Trend line looks important to confirm the bearish side.

>>> Nifty Daily - As Posted Last Weekly Review <<<

>>> Click the chart to see on full chart <<<

Wrote last week 8450 as a good support on Daily chart.

>>> Nifty Daily - Happened and Yet to <<<

>>> Click the chart to see on full chart <<<

Its a Clear Support @ 8450. Nothing to say more.

>>> Nifty Hourly Chart <<<

>>> Click the chart to see on full chart <<<

Yes - Its a Irregular correction that usually occurs in an UpTrend. Hence 8450 Should be the Good Support for a Good Buy.

>>> Bank Nifty Hourly Chart <<<

>>> Click the chart to see on full chart <<<

Looks like a Head and Shoulder Break down. High possibilities of touching the second target @ 17880.

>>> DRREDDY - Posted as on 10th March, 2015 <<<

>>> Click the chart to see on full chart <<<

We gave a Sell call on DrReddy @ 3468. See what happened ?

>>> DRREDDY Hourly - As Posted on 16th March, 2015 <<<

>>> Click the chart to see on full chart <<<

Yes, We have booked Rs.21000 in our short given @ 3468.

>>> COLPAL - As Posted on 13th March, 2015 <<<

>>> Click the chart to see on full chart <<<

Gave a Sell on ColPal as on 10th March, 2015 @ 2105. See what Happened.

>>> COLPAL - Happened and Yet to <<<

>>> Click the chart to see on full chart <<<

Made a Profit Booking @ 2005 with a Part Profit of Rs.12500. We have shorted @ 2105. More fall likely.

>>> STAR - As Posted on 19th March, 2015 <<<

>>> Click the chart to see on full chart <<<

Yes We have shorted @ 1178 and wrote to Sell on every rise.

>>> STAR Hourly - Happened and Yet to <<<

>>> Click the chart to see on full chart <<<

Price Came almost near to the second Target also. More fall likely if breaks the support.


>>> Performance till 20th March, 2015 <<<

>>> Click the image to see on full chart <<<

Send to us email to niftyforall@yahoo.com for getting our details of service.

Thursday, March 19, 2015

Support 8590 If breaks, May Test 8450

Dear All,


The US central bank removed a reference to being "patient" on rates from its policy statement, opening the door wider for a hike in the next couple of months while sounding a cautious note on the health of the economic recovery. Given the developments, analysts feel that the US Federal Reserve could delay interest rate hike beyond June. Among the emerging markets (EMs), India is placed relatively better to weather the interest rate hike related storm, they say.

However Nifty fell down for second straight session and closed near support of 8,600.

Banking shares were under pressure, falling by upto 4% in late afternoon trade and erasing their entire morning gains.

"This fall in index has completely engulfed the rebound of last three sessions, which indicates further fall in the coming sessions. And, we are still upholding our downside target of 8475 in Nifty. Considering the market volatility, traders should maintain extra caution and avoid overleveraging at current levels. Among the sectors indices, PSU banking looks weakest, followed by energy, realty and metal so one can consider stocks from these pivots for fresh shorts," said Jayant Manglik, President-retail distribution, Religare Securities.

>>> Nifty Hourly <<<

>>> Click the chart to see on full screen <<<

It was an unexpected Sell off in the afternoon trade. Nifty ended in deep red. Now 8613 and 8590 looks very important, if breaks, then fall to continue till 8450 also.

We are advising a Long call on nifty till Yesterday - We had a lot of break out on chart, both on Price and RSI front, Suddenly market fell down even after a positive Fed decision. Hence let us see what and where it went wrong technically.

>>> Click the chart to see on full screen <<<

A false break out for sub wave (4) as a-b-c, today both price and RSI changed direction towards a negative side. If all the given support level breaks then fall to continue on weekend day of friday.

>>> Bank Nifty Hourly <<<

>>> Click the chart to see on full screen <<<

18680 Support must hold for an U turn, Else if breaks, Fall to continue as mentioned on chart.

>>> STAR <<<

>>> Click the chart to see on full screen <<<

STAR in its final Leg of rally completed today @ 1198 as 1-5 Wave upmove rally as given on chart. A Doji reveals a cautious tone. If 1198 - Unable to cross above, Get ready for a Free fall. Just Sell Sell and Sell Only.

Wednesday, March 18, 2015

Sell Copper @ 360. SL above 384. Target 300 ??

Dear All,

>>> COPPER - DAILY CHART <<<

>>> Click the chart to see on full screen <<<

Now Sell Copper @ 360 and also Sell on Every Rise with a SL of 384. Target as given on chart. Happy Selling. Cheers!!!

Support @ 8613 & 8592

Dear All,

>>> Nifty Hourly <<<

>>> Click the chart to see on full screen <<<

Great Start on the monring, Price move up, Later - Price unable to hold. Previous such move shows 50 Hour Moving Average should be crossed for a continuous pull back. So lets wait for it.

>>> SBIN <<<

>>> Click the chart to see on full screen <<<

Price comfortably moving above from the channel support. RSI should confirm the trend. Expect a good rally. Cheers!!!

Tuesday, March 17, 2015

Worst is Over ??? Get Ready for Rally !!!

Dear All,

>>> Nifty Hourly - As Posted Yesterday <<<

>>> Click the chart to see on full screen <<<

Yesterday wrote clearly - 8613 and 8590 as a clear support. See what happened.

>>> Nifty Hourly - Happened and Yet to <<<

>>> Click the chart to see on full screen <<<

Clear Break out on RSI. If Price can able to hold above 50 HMA - then Short Covering and Fresh Rally on Card. Just Buy.

>>> Bank Nifty Hourly - As Posted Yesterday <<<

>>> Click the chart to see on full screen <<<

It was a clear message from Bulls Yesterday - See what happened ?

>>> Bank Nifty Hourly - Happened and Yet to <<<

>>> Click the chart to see on full screen <<<

Clear break out form Wedge and RSI. Price above 50 HMA. Nothing more to say. Get REady for a Rally. Cheers!!!

Monday, March 16, 2015

Support @ 8612 & 8592

Dear All,

>>> Nifty Hourly Chart <<<

>>> Click the chart to see on full screen <<<

Channel Support if Holds, Expect a recovery. 8612 or 8590 Act as a good support.

>>> Bank Nifty - Hourly Chart <<<

>>> Click the chart to see on full screen <<<

Looks like an Expanding Triangle. RSI on Clear Break Out. So all together - Get ready if the wedge breaks out on Price, Short Covering and Rally.

>>> DRREDDY - As Posted on 10th March, 2015 <<<

>>> Click the chart to see on full screen <<<

Wrote on 10th march to Sell DrReddy. See what happened ?

>>> DRREDDY - Happened <<<

>>> Click the chart to see on full screen <<<

We shorted @ 3468 and today made a low of 3301. Profit so far Rs.21000.

>>> COLPAL - As Posted on Weekly Review <<<

>>> Click the chart to see on full screen <<<

Wrote on weekly review - Stock completed its rally as 1-5. See what happened ?

>>> COLPAL - Happened and Yet to <<<

>>> Click the chart to see on full screen <<<

Made a Small Profit of Rs.8750 or 70 Points fall from 2105. Expect more fall. Sell on rise. Cheers!!!