>>> Nifty Hourly Chart <<<

>>> Click the chart to see on full screen <<<
Price below 8380 - Looks like RSI supporting the bear for the next support at 8200.
>>> Click the chart to see on full screen <<<

>>> Click the chart to see on full screen <<<

>>> Click the chart to see on full screen <<<

>>> Click the chart to see on full screen <<<

>>> Click the chart to see on full screen <<<

>>> Click the chart to see on full screen <<<

>>> Click the chart to see on full screen <<<

>>> Click the chart to see on full screen <<<

>>> Click the chart to see on full screen <<<

>>> Click the chart to see on full screen <<<

>>> Click the chart to see on full screen <<<

>>> Click the chart to see on full screen <<<

>>> Click the chart to see on full screen <<<

>>> click the chart to see on full screen <<<

>>> click the chart to see on full screen <<<

>>> Click the chart to see on full screen <<<

>>> Click the chart to see on full screen <<<

>>> Click the chart to see on full screen <<<

>>> Click the chart to see on full screen <<<

>>> Click the chart to see on full screen <<<

>>> Click the chart to see on full screen <<<

>>> Click the chart to see on full screen <<<

>>> Click the chart to see on full screen <<<

>>> Click the chart to see on full screen <<<

>>> Click the chart to see on full screen <<<

>>> Click the chart to see on full screen <<<

>>> Click the chart to see on full screen <<<

>>> Click the chart to see on full screen <<<

>>> Click the chart to see on full screen <<<

>>> Click the chart to see on full screen <<<

>>> Click the chart to see on full screen <<<
>>> Click the chart to see on full screen <<<

>>> Click the chart to see on full screen <<<

>>> Click the chart to see on full screen <<<

>>> Click the chart to see on full screen <<<

>>> Click the image to see on full screen <<<

>>> Click the chart to see on full screen <<<

>>> Click the chart to see on full screen <<<

>>> Click the chart to see on full screen <<<

>>> Click the chart to see on full screen <<<

>>> Click the chart to see on full screen <<<

>>> Click the chart to see on full screen <<<

>>> Click the chart to see on full screen <<<

>>> Click the chart to see on full screen <<<

>>> Click the chart to see on full screen <<<
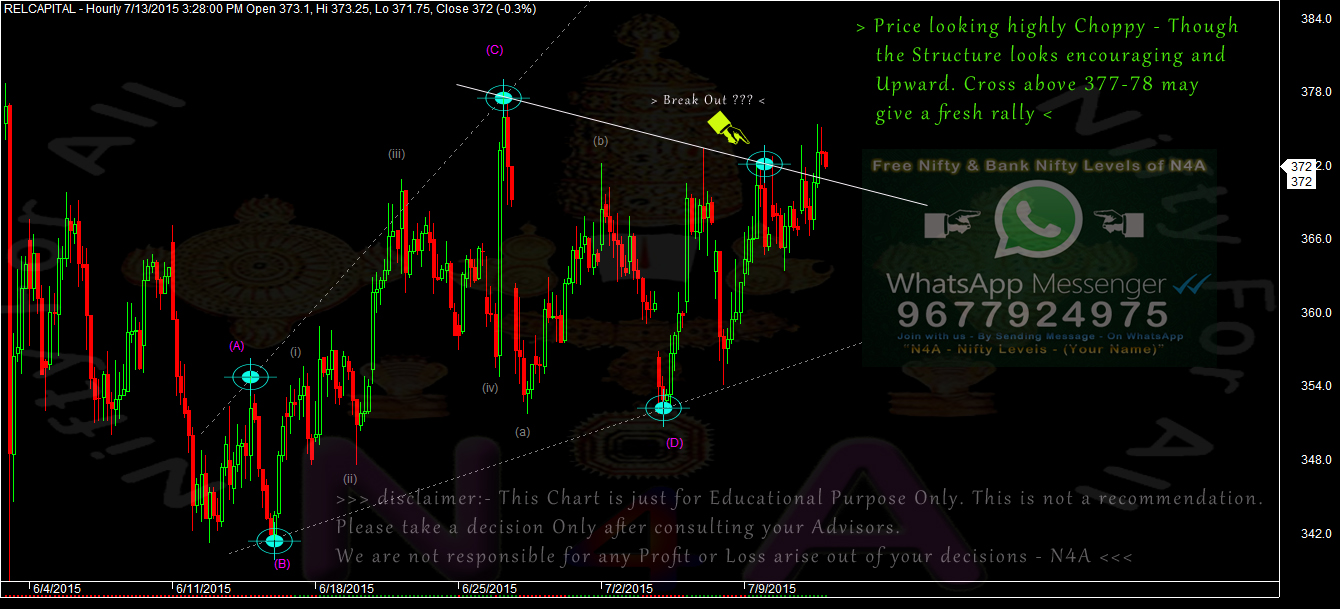
>>> Click the chart to see on full screen <<<

>>> click the chart to see on full screen <<<

>>> click the chart to see on full screen <<<

>>> click the chart to see on full screen <<<

>>> click the chart to see on full screen <<<

>>> click the chart to see on full screen <<<

>>> click the chart to see on full screen <<<

>>> click the chart to see on full screen <<<


