>>> Weekly Chart - As Updated Last Weekly Review <<<
>>> click the chart to see on full screen <<<
Last week wrote about the break out on Weekly Chart.
>>> Happened and yet to <<<
>>> click the chart to see on full screen <<<
Doji candle on weekly chart. Indecision. So lets see on daily and hourly for clear trend.
>>> Daily Chart - As Updated Last Weekly Review <<<
>>> click the chart to see on full screen <<<
Last week mentioned about IHS break out on daily chart.
>>> Happened and Yet to <<<
>>> click the chart to see on full screen <<<
So the price re-tested the trend line. Hope it will continue to upmove.
>>> Nifty - Hourly Chart <<<
>>> click the chart to see on full screen <<<
Hourly Chart shows a clearly picture for an uptrend. Last week ended sub wave 4 and started moving up for sw 5.
We covered our earlier shorts with nearly 100 points profit and long since 6430-40. Good upmove should continue if able to cross the channel. Lets see.
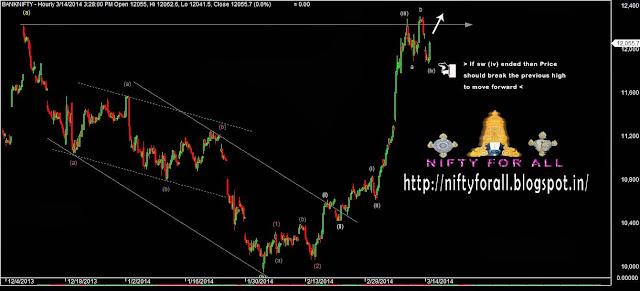
>>> Bank Nifty - hourly - As updated Last weekly review <<<
>>> click the chart to see on full screen <<<
Last week wrote about Key resistance on Bank Nifty.
>>> Happened and yet to <<<
>>> click the chart to see on full screen <<<
may be the end of sub wave (iv), if so then get ready for new high next week. Else break below the last week low may trigger some more correction.
>>> Flops of Last Week <<<
>>> Tata Steel <<<
>>> click the chart to see on full screen <<<
>>> Rcom <<<
>>> click the chart to see on full screen <<<
>>> Hit of Last Week <<<
>>> BIOCON <<<
>>> click the chart to see on full screen <<<
>>> Asian Paints <<<
>>> click the chart to see on full screen <<<
>>> Voltas <<<
>>> click the chart to see on full screen <<<


No comments:
Post a Comment