Markets on Friday clocked their fourth straight weekly gain amid positive global investor sentiment and by gains in HDFC Bank and Sun Pharmaceuticals.
Sentiment also got a boost after RBI Governor Urjit Patel said India’s economic growth will make a “sharp V” recovery after a short drop in the aftermath of demonetisation.
The central bank put HDFC Bank back on the FII ban list after foreign shareholding exceeded the prescribed limit of 74% within hours of trading.
Earning is a big factor which can influence stock prices. The fear which clouded Indian markets in the name of demonetisation and Trumponomics seems to have receded. The DeMon or demonetisation could show its ugly face in March quarter results. The recent run-up in the Indian market may not sustain without better support from earnings and fundamentals. “The December quarter saw a strong recovery in earnings from a very low base in several sectors but underlying trends continue to be subdued with demonetisation adding to the woes.
The next week will be truncated, as stock exchanges will be closed on Tuesday on account of Municipal Corporation Elections in Mumbai and, on Friday, on account of Mahashivratri. But volatility is expected to rise ahead of expiry of February series futures and options contracts on Thursday.
Further progress on GST is necessary on GST in the Budget session of Parliament for its implementation in H1FY18. A positive outcome for BJP in the state elections may lead the markets higher, at least in the short term.
>>> Nifty Weekly Chart - Bear Warning ??? <<<
>>> Click the chart to see on full screen <<<
Its a Red Doji near the trend line again, Might be a Caution sign from Bear.
>>> Nifty Daily - Posted on February - First Weekly Update - 04th Feb, 2017 <<<
>>> Click the chart to see on full screen <<<
Wrote on 04th Feb, 2017 - Nifty had Two choice 8770 or 8890. Second Alternative achieved today - made a high of 8885. so whats Next ?
>>> Nifty Daily Chart - What's Next <<<
>>> Click the chart to see on full screen <<<
If the above analysis is not wrong - Price has completed ABC wave and may start a possible correction any time. Else may trigger next round of rally.
>>> Nifty Hourly chart - Two Alternatives <<<
>>> Click the chart to see on full screen <<<
Above 8890 - another rally may start.
>>> Bank Nifty Weekly Chart - Bear Warning ??? <<<
>>> Click the chart to see on full screen <<<
Price might have completed 1 to 5 rally, If this is not wrong, Expect a correction. Else the count analysis may get truncated.
>>> Bank Nifty Daily Chart <<<
>>> Click the chart to see on full screen <<<
Price Spike only for a Single Stock - No major news on Sector Wise - So far Results are also not encouraging for many banks.
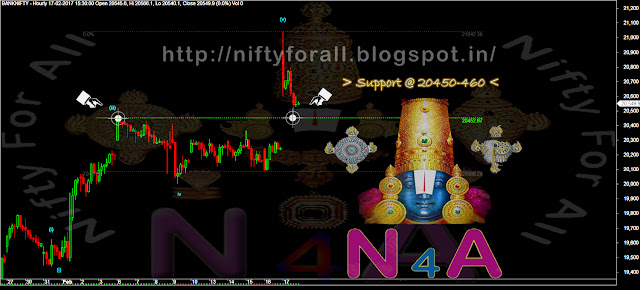
>>> Bank Nifty Hourly Chart <<<
>>> Click the chart to see on full screen <<<
20450-460 If holds - Price may try to breach one more high. Else may start correcting.
>>> CNX-IT Daily Chart <<<
>>> Click the chart to see on full screen <<<
Price may find its resistance at channel top as shown on chart.
>>> AdaniPort - Hourly - Posted on 15th Feb, 2017 - We had Short Position <<<
>>> Click the chart to see on full screen <<<
Posted on 15th Feb, 2017 - Wrote Price may correct.
>>> AdaniPort - Hold Your Shorts for more fall <<<
>>> Click the chart to see on full screen <<<
Hold Your Shorts and Price may test the channel support any time.
>>> Performance till 17th Feb, 2017 <<<
>>> Click the image to see on full screen <<<
Above performance is not a Pomise or guarantee for the given Profits or Loss.Performance given based on 1 lot at a time and clients Profit differ as per the margin availability and Number of Lots taken by them. We may or may not re-enter the Calls given here hit Stop Loss, as per market movement. The charts given above are just for educational purpose only and we don't recommend any Entry / Buy or Exit / Sell. Reader must taken their own decision or consult their qualified Analyst before making any decision
>>> N4A - Service <<<


No comments:
Post a Comment