Pages

Saturday, October 12, 2013

Weekly Review :- 14.10.2013

Dear All,


>>> NIFTY DAILY <<<

>>> Click the chart to see on full screen <<<

Hanging Man on Daily chart. May be the end of Wave B. So Next week move may confirm the start of Wave C on the downside.

>>> NIFTY HOURLY - As given on Last Weekly Review <<<

>>> Click the chart to see on full screen <<<

Alt 1 worked out and nifty moved above 6048. So lets see whats next.

>>> NIFTY HOURLY - Happened and Yet to <<<

>>> Click the chart to see on full screen <<<

Wave B extending beyond 6048 as Last leg of Wave B extended as 1-5. Now 6108 and 6142 remains as resistance. Expect Wave C to start from here onwards for next week.

>>> BANK NIFTY <<<

>>> Click the chart to see on full screen <<<

Bank Nifty should hold 61.8% fib level for next Up move, else may confirm the end of Wave b.

>>> PERFORMANCE <<<

>>> Click the image to see on full screen <<<

Thursday, October 10, 2013

INFY day

Dear All,


More or less I should call tomorrow as day of INFY. Since Nifty is hanging on the top and more volatile with lot of turn around news from Economy front like Improved CAD and fast recovering INR, Market looking for a Break through for moving into next stage.

INFY which was in trouble in recent past, faced some important management reshuffle. Take over by Narayana Murthy on board along with his son have raised expectation from the India 2nd Larger IT company.

INFY DAY :-

Analysts expect Infosys to raise its full-year revenue guidance in dollars while announcing its second-quarter results on Friday, driven by a more aggressive sales strategy and demand revival in the US. While many brokerages revised their revenue growth estimates for fiscal 2014, most forecasts fell in the 8-11% range. This is higher than the 6-10% that the Bangalore-based company had given in March

The higher growth expectations are driven by the perception that there is greater aggression and better management focus at Infosys in chasing large technology outsourcing contracts, especially as demand improves in the United States, its largest market. The return of cofounder and former chairman NR Narayana Murthy in June has added to the optimism.

On the profitability front, Infosys is expected to report the lowest growth among India's large software providers due to the impact of recent wage revisions, pricing pressures and costs incurred from the ongoing organisational restructuring. Analysts expect a 10% to 16% net profit growth in rupee terms and 40 to 70 basis points fall in operating margins despite the depreciation of rupee, which fell over 10% against the US dollar during the July-September period.

Since returning to the company he co-founded with six others in 1981, Murthy has sought three years to rebuild a "desirable" Infosys.
Under Murthy, Infosys has been cutting costs in overseas work locations and focusing more on winning deals in traditional areas such as software development and managing IT infrastructure for large corporations After his return the company has seen several senior executives leaving the company, including North America head Ashok Vemuri and global sales chief Basab Pradhan.

The fall in rupee has been seen as a big positive for the Indian IT sector. The currency may have recovered from the lows of just about 69, but it has lost too much in too short a period, and is much below the levels seen not too far back. Good for the IT sector, analysts have been crying since long. Particularly talking about Infosys, the now-disputed poster boy of the Indian IT sector; the company would be announcing its keenly awaited Q2 results tomorrow.

So lets see what Technical Says :-

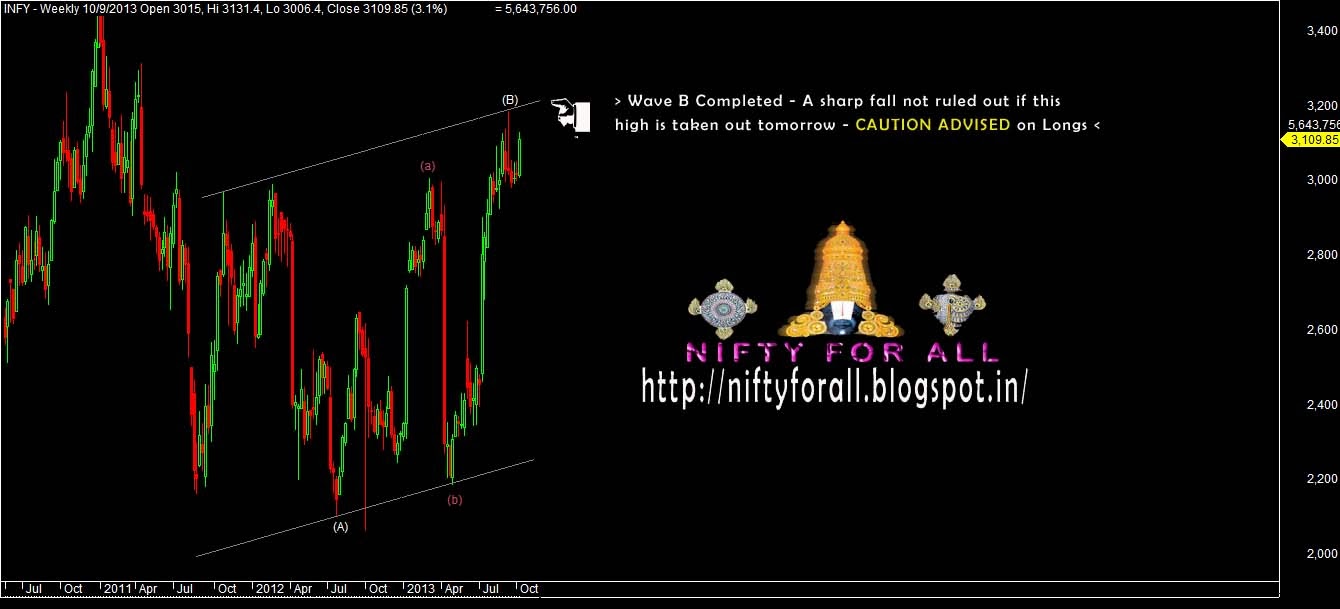
>>> Weekly Chart - INFY <<<

>>> Click the chart to see on full screen <<<

Weekly Chart shows Wave B has almost comleted and Wave C may start any time. Means a fall waiting on card. Lets see in details on Hourly Chart how the last upmove has been done.

>>> Hourly Chart - INFY <<<

>>> Click the chart to see on full screen <<<

As gap Up seen on Hourly chart was done after Narayana Murthy's re-entry on board. So its an extension as a-b-c-d-e. Right now the upmove looks like almost completed.
For tomorrow - Recent high 3188 - top looks very crucial. I hope its the end of wave B. If not taken out then Wave C must start and a fall not ruled out. Caution advised.

>>> NIFTY <<<

>>> Click the chart to see on full screen <<<

Nifty had a very choppy session today. No change in view, still 6048 is not taken out. So lets wait for direction.

Wednesday, October 09, 2013

Caution Advised ...!!!

Dear All,

>>> Click the chart to see on full screen <<<

Yes I advice Caution as Nifty is nearing 6048. So as per current Scenario its seems Nifty may move as a-b-c-d-e or a-b-c. On either case 6048 should resist. Lets See.

>>> BANK NIFTY <<<

>>> Click the chart to see on full screen <<<

Bank Nifty also facing resistance as shown on chart. If unable to cross the resistance line may see a sharp sell off. Lot of possibilities to fill the gap left on the down side. Caution advised.

Tuesday, October 08, 2013

Range between 5922 & 5974

Dear All,

>>> Click the chart to see on full screen <<<

Nifty range between 5922 and 5974. Break any of these level may decide the direction.

Monday, October 07, 2013

Support 5826 - Resistance 5974

Dear All,

>>> Click the chart to see on full screen <<<

It seems once again once again nifty enter into volatile trade. So again two alternative given here.

First alternative shows Resistance at 5922, if unable to cross may see a sharp correction below Support level 5826. The move shall be A-B-C.

Second alternative, if able to cross above 5922 and 5950 may see upmove till 5974 and 6048. The move shall be 1-5.

>>> LT - As given on 03rd Oct, 2013<<<

>>> Click the chart to see on full screen <<<

Wrote on 03rd Oct, 830 to act as a good resistance.

>>> Happened and Yet to <<<

>>> Click the chart to see on full screen <<<

Booked near First Target 800. More downside left if Resistance 830 is not taken out. Lets See

>>> BPCL <<<

>>> Click the chart to see on full screen <<<

Yes, Holding Short on BPCL. Lets See.

Saturday, October 05, 2013

Weekly Review :- 07.10.2013

Dear All,

>>>> NIFTY - As given in Last Weekly Review <<<

>>> Click the chart to see on full screen <<<


Last Weekly Review mentioned as 5733 or 50% fib level as a good support, so every one saw what happened and lets see whats next

>>> Happened and Yet to <<<

>>> Click the chart to see on full screen <<<


It seems like the current upmove shall be marked as wave b, hence it shows that the upmove may terminate any time for a possible down trend. MACD still on sell mode should be noted. So caution advised. Lets see in detail on hourly chart, how far the upmove may continue with a possible downside target.

>>>> NIFTY HOURLY - As given in Last Weekly Review <<<

>>> Click the chart to see on full screen <<<


Last Weekly - Two alternative given. As per the second alternative worked, broken the low of 5811 and touched 5701.

>>>> HAPPENED AND YET TO <<<<

>>> Click the chart to see on full screen <<<


This week also we have two alternatives..

As per the current scenario - wave b may extend till 5974 or even 6048. But if unable to hold 5922 then wave b may terminate for an immediate fall. In that case 5637 visible. Lets See.

>>> BANK NIFTY - As given in Last Weekly Review <<<

>>> Click the chart to see on full screen <<<

Two Fib level given as support last week. So Bank Nifty took support at 61.7% Fib level and bounced.

>>> HAPPENED AND YET TO <<<

>>> Click the chart to see on full screen <<<

As gave on last weekly review - Bank Nifty took support at 61.8% fib level, Now the upmove should face resistance at 38.2% and 50% fib level. Unable to cross may trigger sell off. Lets See.

>>> BLOCK BUSTER CHARTS OF THE WEEK <<<

>>> CENTURYTEX <<<

>>> Click the chart to see on full screen <<<

>>> LT <<<
>>> Click the chart to see on full screen <<<

>>> Follow up on - 03rd Oct 2013 <<<

>>> Click the chart to see on full screen <<<

>>> ONGC <<<

>>> Click the chart to see on full screen <<<


>>> FLOP OF THE WEEK - Bata India <<<

>>> Click the chart to see on full screen <<<
Last week Flop was Bata India. We shorted at 857 and Exited at 883. Lost nearly 13000/- As shown on the chart, when price cross the Resistance line, Forced to exit. But the Price just made a high of 884.55 and came down and closed at 865. Its a Big miss for us. So whats next in this Stock.

>>>> Whats Next on Bata India <<<

Now Bata India should break the Yellow colored channel as shown on chart for fresh short. If breaks then Free Fall or Blood bath not ruled out. Those who made short last time as per my blog may carry on the short or even enter fresh short if breaks the channel as shown here. Lets See.
>>> Click the chart to see on full screen <<<

>>> PERFORMANCE <<<
>>> Click the image to see on full screen <<<

Thursday, October 03, 2013

Resistance 5922 & 5974

Dear All,


The finance minister may have to slice at least Rs 20000 crore ($3.2 billion) from government spending to prevent a budget blow-out, which could threaten to send the country's credit rating into "junk" status, two ministry officials said.

If he goes ahead with cuts, the minister would likely focus on areas of discretionary spending but keep programmes, such as food subsidies, in place as state and national elections near, these officials said

Chidambaram, who last year oversaw cuts worth over Rs 1 trillion, is aiming to prevent the budget for the fiscal year to March 2014 from stretching beyond a deficit target of 4.8 per cent of GDP.

"With oil subsidies up by about Rs 30000 crore, the government may have to cut expenditure by around Rs 20000 crore in addition to usual savings of around Rs 30000 crore at the end of the year," said a senior finance ministry official.

Fearing defeat in state elections likely due in November and in national polls due by May next year, government has balked at cutting its hefty oil subsidy bill and recently introduced a costly food subsidy scheme targetted at the rural poor who are the ruling Congress party's core voters

Last month, it deferred a plan to raise diesel prices by close to 10 per cent in one go that could have sharply cut the oil subsidy burden, estimated at over Rs 90000 crore for the current fiscal year - nearly 40 per cent more than budgeted.

The government also introduced subsidised grain to 67 per cent of the 1.21 billion population and has set in motion a substantial revision in salaries and pensions for almost 8 million government workers.

>>> NIFTY <<<


>>> Click the chart to see on full screen <<<


Chinese Non-Manufacturing PMI data, Rupee appreciation helped Nifty to gain strength today. Shut down of US govt and Fall in Dollar helped Rupee to appreciate today also. Now facing resistance at 5922 and 5974. Lets See.

>>> LT <<<

>>> Click the chart to see on full screen <<<


LT - facing resistance at 830. If unable to cross may see sharp sell off, else need to cross above the upper channel for any upmove. lets See.

>>> BATA INDIA <<<

>>> Click the chart to see on full screen <<<


Bata India - If unable cross Resistance may see Sell Off. Lets See.

Tuesday, October 01, 2013

Sell On Rise ?

Dear All,


India manufacturing output falls for second month: HSBC PMI

The PMI for manufacturing, although marginally up from the previous month, stood at 49.6 points in September from 48.5 points in August, indicating moderate contraction in the sector.

A reading above 50 indicates growth and below that depict contraction.

The PMI quarterly average for the second quarter of this year was the lowest since the fourth quarter of 2008.

Employment fell for the first time in around 19 months, mainly due to reduction in new order levels. There was a sharp rise in input costs this month, with all three sectors covered by the survey signalling "stronger rates of cost inflation in the latest month".

Faced with fewer projects, companies reduced their workforce numbers for the first time since February 2012.

According to official data, high imports of gold and oil pushed Current Account Deficit (CAD) to 4.9 per cent of GDP at USD 21.8 billion in the April-June quarter of the current fiscal.

>>> NIFTY <<<

>>> Click the chart to see on full screen <<<


Nifty paused the fall today and shows some pull back due to positive CAD news last evening. Though Shutdown Looms may take a toll on US dollar which may favour Indian INR, I hope US may soon come to a conclusion in congress which may once again impact Rupee. HSBC PMI did not cheer the market.

Though the fall was Puased, important resistance 5784, 5810 and 5835 looks crucial and looks like a Sell on Rise is good for now. Lets See.

>>> BANK NIFTY - As Updated on Last Weekly Review <<<

>>> Click the chart to see on full screen <<<


>>> HAPPENED AND YET TO <<<

>>> Click the chart to see on full screen <<<


As said 61.8% giving a good support. Lets wait for more clarity.

>>> ONGC - As given Yesterday <<<

>>> Click the chart to see on full screen <<<


>>> HAPPENED <<<

>>> Click the chart to see on full screen <<<


Booked More Profit on ONGC. Met our Target, though looks week and more downside possible.

>>> LT - As given Yesterday <<<

>>> Click the chart to see on full screen <<<


>>> HAPPENED AND YET TO <<<

>>> Click the chart to see on full screen <<<


Today LT made a low of 776 which is near to our first target 770. Now as per H&S pattern, expect stock to slide more. Lets See.

Monday, September 30, 2013

Broken Support 5733

Dear All,

A government shutdown: What could it look like?

The federal government moved closer to its first shutdown in 17 years after the Republican-led House voted early Sunday to delay President Barack Obama’s health-care law by one year as part of legislation to keep the government running.


If House Republicans and Senate Democrats cannot agree by the Tuesday-morning deadline, thousands of government employees will be unable to work.

There will be one more round of votes until a government shutdown is certain.

First, Reid and his fellow Democrats in the Senate are likely to vote on Monday afternoon to table the House measure. Aides said they only need 51 votes to block the bills. Democrats control 54 votes in the chamber. This will sideline conservative Republicans in the Senate led by Sen.


"The American people don't want a government shutdown, and they don't want Obamacare," House Republican leaders said in a statement. "We will do our job and send this Bill over, and then it's up to the Senate to pass it and stop a government shutdown."

>>> NIFTY <<<

>>> Click the chart to see on full screen <<<

Nifty Broken Crucial Support 5733. Lets wait for 5637.

>>> CENTURYTEX <<<

>>> Click the chart to see on full screen <<<

CenturyTex Part Booked. Holding for Target.

>>> LT <<<

>>> Click the chart to see on full screen <<<

LT booked Part Profit and Holding for Target.

>>> ONGC <<<

>>> Click the chart to see on full screen <<<

ONGC part profit booked at 266. Stock made a low of 262.65. More downside left

Saturday, September 28, 2013

Weekly Review - 30.09.2013

Dear All,

Market on the peak of Volatile last week, since there is no flow of news market lacked direction on either side.

Current account deficit:-

No relief from any front, a Reuters poll of five economists predicting the June quarter current account deficit rising to $23-25 billion, or 4.8-5.4% of the GDP, from $18.1 billion, or 3.6 per cent, in the March quarter, couldn't have come at a worse time. Good enough to hold the bulls. The numbers will be out on Monday.

Raghuram Rajan Warned :-

RBI's new chief Raghuram Rajan had sent a warning signal three years ahead of the 2008 global financial crisis.

Just days back, he seems to have done it again, saying that there is a danger of bubbles forming around the globe due to easy monetary policy implemented to steer the world back into a more robust growth path.

"We seem to be in a situation where we are doomed to inflate bubbles elsewhere," Rajan said.

"We should wonder whether lower and lower interest rates are in fact part of the problem, I say I don't know."

Outlook :-

Markets are likely to remain range bound in the week ahead as investors would adopt wait-and-watch stance ahead of second quarter earnings. Meanwhile, reports suggest that brokerages are likely cut their expectations of growth in earnings per share (EPS) for large companies to mid-single digits on the back of factors including higher interest rates, lower domestic demand and higher cost of imported raw materials.

Markets will closely monitor key economic data such as current account deficit, balance of payments on Monday.

Data for HSBC India Manufacturing Purchasing Manager's Index (PMI) for the month of September is scheduled for release on Tuesday.

Further, the trends in the Indian rupee, crude oil prices and FII activity would also be on the radar of investors.

Auto and cement stocks are likely to be in action after they start releasing their September sales and dispatch numbers.

>>> Nifty Weekly <<<

>>> Click the chart to see on full screen <<<

Above Weekly Chart suggest an a-b-c-d-e movement and we are on the last leg of 5 wave upmove. Hence we have still more upside left.

>>> Nifty Daily <<<

>>> Click the chart to see on full screen <<<

As per Daily Chart we need to correct a bit till support 2 before next upmove. Detail analysis on what are the possibilities at Hourly chart.

>>>> Nifty Hourly <<<<<

>>> Click the chart to see on full screen <<<

Two alternatives - both directions are as per sub wave (iv), we are facing lot of volatile as the a-b-c wave moving with lot of zig-zag. Hope all readers got clear direction as per the above charts.

>>>> Bank Nifty - Weekly <<<<

>>> Click the chart to see on full screen <<<

Bank Nifty Weekly - stuck in between two lines inside a Pitchfork. Unable to hold 100wma should be noted.

>>> Bank Nifty - Daily <<<

>>> Click the chart to see on full screen <<<

On Daily front I assumed the ongoing as a 5 wave upmove. Hence should take support at 50% or 61.8% means we should move up soon after the expected correction. Let see

>>> PERFORMANCE <<<

>>> Click the chart to see on full screen <<<