Pages

Saturday, October 26, 2013

Weekly Review - 28.10.2013

Dear All,

>>> NIFTY WEEKLY <<<

>>> Click the chart to see on full screen <<<

Weekly Chart suggest more upside left. RSI & CCI indications break out shows greater strength for Bulls. Bear Traders should remain cautious.

>>> NIFTY - DAILY - As published on Last Weekly Review <<<

>>> Click the chart to see on full screen <<<

So lets see what happened this week too.

>>>> Happened and Yet to <<<

>>> Click the chart to see on full screen <<<

Crossed the previous high as wrote last week, but unable to hold. Also if break the low mentioned on chart - then bear may get first sell signal. Should wait and watch.

>>> NIFTY - HOURLY - As given on Last Weekly Review <<<

>>> Click the chart to see on full screen <<<

>>> Happened and yet to <<<

>>> Click the chart to see on full screen <<<

Two alternative discussed on Hourly chart. Lets wait and see.

>>> BANK NIFTY - DAILY <<<

>>> Click the chart to see on full screen <<<

Notes on the chart.

>>> Block Buster Chart of the Week <<<

>>> LT <<<

>>> Click the chart to see on full screen <<<

>>> HCL Tech <<<

>>> Click the chart to see on full screen <<<

>>> CIPLA <<<

>>> Click the chart to see on full screen <<<

>>> IDFC <<<

>>> Click the chart to see on full screen <<<

>>> ICICI BANK <<<

>>> Click the chart to see on full screen <<<

>>> Chart of the Week - Bank of Baroda <<<

>>> Click the chart to see on full screen <<<

>>> Performance <<<

>>> Click the image to see on full screen <<<

Thursday, October 24, 2013

Profit Booking or Correction ???

Dear All,

>>> Click the chart to see on full screen <<<

After breaking 6220 nifty made a fresh high of 6252 and started falling till the bottom of the channel. Now again 50 Hr MA got support along with the channel. Lets see how it work for tomorrow as usual.

>>> ICICI Bank - As updated on 22nd OCt, 2013 <<<


>>> Click the chart to see on full screen <<<


>>> Happened <<<

>>> Click the chart to see on full screen <<<

After a lot of consolidation - Price broken out and hit the target. Patience Paid.

>>> IDFC - As updated on 22nd Oct 2013 <<<

>>> Click the chart to see on full screen <<<


>>> Happened and Yet to <<<


>>> Click the chart to see on full screen <<<

IDFC booked some part profit near 106. IDFC made a high of 105.80. Looking for some more upmove soon.

Wednesday, October 23, 2013

Support 6126 & 6104

Dear All,

>>>Click the chart to see on full screen<<<

Nifty broken the pitchfork and 6160. But able to hold 50hr moving average shows that last leg may get extended as wrote yesterday. Now 6126 and 6104 should hold for any upmove. Lets See.

Tuesday, October 22, 2013

Support 6160

Dear All,

>>>Click the chart to see on full screen <<<

Lackluster move. 6160 important support. As shown on chart, if hold the support, rally may continue since the last leg seems like extending further. Else Correction 6030 may happen for 4th sub wave. Lets wait and see.

>>> IDFC <<<

>>>Click the chart to see on full screen <<<

IDFC - Price returned from the hurdle line today. Expect a good bounce once hurdle crosses. Yes we are holding Long in this counter.

>>> ICICI Bank <<<

>>>Click the chart to see on full screen <<<

ICICI Bank looks like a Flag pattern with good volume, though 1024 resisted hardly for 2 times. If crosses then good upmove should push the stock on the upper side. Lets see.

Monday, October 21, 2013

Wait for a Correction

Dear All,

>>> Click the chart to see on full screen <<<

Nifty must correct for sub wave 4, should cool down before next upmove. So wait for correction.

>>> LT - As given on Last Weekly Review <<<

>>> Click the chart to see on full screen <<<


>>> Happened today <<<

>>> Click the chart to see on full screen <<<

All three targets done.

>>> HCL Tech - As given on 17th Oct 2013<<<

>>> Click the chart to see on full screen <<<


>>> Happened today <<<

>>> Click the chart to see on full screen <<<

First Target met today.

>>> Cipla <<<

>>> Click the chart to see on full screen <<<

Cipla done second target also. Cheers!!!

Sunday, October 20, 2013

Weekly Review - 21.10.2013

Dear All,

>>>Weekly Chart Published as on 29th Sep Weekly Review <<<

>>> Click the chart to see on full screen <<<

As we gave on 29th Sep, mentioned about the possibilities of moving up till 6500. So lets see what happened as given below.

>>> Happened and Yet to as per weekly chart <<<

>>> Click the chart to see on full screen <<<

Last week upmove seems like moving towards the target as expected earlier. Weekly RSI break out also seems more positive. So more fire works expected before diwali.

>>> Nifty - Daily Chart <<<

>>> Click the chart to see on full screen <<<

Price broken out of the channel and moving towards previous high as marked with red colored arrow. If breaks above the previous high then should reach the given targets. Watch out MACD also for break out which may add fuel to the upmove.

>>> Nifty - Hourly Chart <<<

>>> Click the chart to see on full screen <<<

Channel line and counts are changed from previous week as the mentioned on friday post. Now 5 wave upmove is ON and Price moving on the last leg of upmove. I expect this 5th wave should be lengthier than 3rd wave. Lets See.

>>> Bank Nifty - Hourly <<<

>>> Click the chart to see on full screen <<<

Bank Nifty had a two alternative, First one should be bearish one if unable to break above the channel. The a-b-c-d-e shall be Wave B and a fall may start for wave C on the downside if unable to break above the channel.
Second alternative shall be bullish and may move up is able to break above the channel as 5th wave move as 1-5.
A bullish break out shall help Nifty to move up fast. Interesting days to come as Banking Licence and Monetary Policy nearing.

>>> Block Buster Charts of the Week <<<

>>> HCL Tech <<<

>>> Click the chart to see on full screen <<<

HCL Tech broken the wedge and fell down. Yes we made some good profit. Expect more fall coming and I advice sell on every rise for a good fall.

>>>> JP Associates <<<

>>> Click the chart to see on full screen <<<

Jp Associates - We had a Long position from 43.50, Part Booked at 44.50.

>>> Happened and Yet to <<<

>>> Click the chart to see on full screen <<<

First Target met and Booked more profit. More upside in next week also.

>>> LT <<<
>>> Click the chart to see on full screen <<<

LT hit both target.

>>> FLOP OF THE MONTH - BPCL <<<

>>> Click the chart to see on full screen <<<

Initiated Short on BPCL earlier on 07th Oct as the wedge broken down. Instead the Price consolidated and moved up. See what happened as below given chart.

>>> Happened <<<
>>> Click the chart to see on full screen <<<

Booked Loss and Exited.

>>> PERFORMANCE <<<

>>> Click the image to see on full screen <<<

Thursday, October 17, 2013

Support 6017 & 5984

Dear All,

>>> Click the chart to see on full screen <<<

Broken the channel and took support on 50 hr Moving Average. Now time to look at the second alternative. So I have marked the possibilities of third wave up move also. In that case 6017 and 5984 should not broken. If broken then we are on Wave C and downside is confirmed. Possible downside should be 5700 or near to it. So lets wait for the weekend trading for tomorrow.

>>> JP Associates <<<

>>> Click the chart to see on full screen <<<

Holding Long in JP Associates with some Part Profit Booked. If price stays above the Upper side channel as shown on chart, more upmove coming. Lets See.

>>> HCL Tech <<<

>>> Click the chart to see on full screen <<<

HCL Tech today confirmed the break down with good volume. We Booked some part profit. Still more downside left.

Tuesday, October 15, 2013

6142 - Crossed but Bull failed to Hold.

Dear All,

>Click the chart to see on full screen <

6142 Crossed on Intraday, but failed to hold. If crosses again due to good TCS results, then the entire scenario may get changed to bullish. Shall update the same once it get changes.

But if breaks the channel on the downside, the fall may continue as A-B-C. Lets wait and see.

> CENTURY TEX <

>Click the chart to see on full screen <

Century Tex broken the raising wedge pattern. 254 an important support, if unable to hold may trigger more selling. Lets See.

Monday, October 14, 2013

6142 Resistance

Dear All,

>>> click the chart to see on full screen <<<

No movement as usual on market. No space to trade also. RIL & TCS results may show the next move. Lets See.

Saturday, October 12, 2013

Weekly Review :- 14.10.2013

Dear All,


>>> NIFTY DAILY <<<

>>> Click the chart to see on full screen <<<

Hanging Man on Daily chart. May be the end of Wave B. So Next week move may confirm the start of Wave C on the downside.

>>> NIFTY HOURLY - As given on Last Weekly Review <<<

>>> Click the chart to see on full screen <<<

Alt 1 worked out and nifty moved above 6048. So lets see whats next.

>>> NIFTY HOURLY - Happened and Yet to <<<

>>> Click the chart to see on full screen <<<

Wave B extending beyond 6048 as Last leg of Wave B extended as 1-5. Now 6108 and 6142 remains as resistance. Expect Wave C to start from here onwards for next week.

>>> BANK NIFTY <<<

>>> Click the chart to see on full screen <<<

Bank Nifty should hold 61.8% fib level for next Up move, else may confirm the end of Wave b.

>>> PERFORMANCE <<<

>>> Click the image to see on full screen <<<

Thursday, October 10, 2013

INFY day

Dear All,


More or less I should call tomorrow as day of INFY. Since Nifty is hanging on the top and more volatile with lot of turn around news from Economy front like Improved CAD and fast recovering INR, Market looking for a Break through for moving into next stage.

INFY which was in trouble in recent past, faced some important management reshuffle. Take over by Narayana Murthy on board along with his son have raised expectation from the India 2nd Larger IT company.

INFY DAY :-

Analysts expect Infosys to raise its full-year revenue guidance in dollars while announcing its second-quarter results on Friday, driven by a more aggressive sales strategy and demand revival in the US. While many brokerages revised their revenue growth estimates for fiscal 2014, most forecasts fell in the 8-11% range. This is higher than the 6-10% that the Bangalore-based company had given in March

The higher growth expectations are driven by the perception that there is greater aggression and better management focus at Infosys in chasing large technology outsourcing contracts, especially as demand improves in the United States, its largest market. The return of cofounder and former chairman NR Narayana Murthy in June has added to the optimism.

On the profitability front, Infosys is expected to report the lowest growth among India's large software providers due to the impact of recent wage revisions, pricing pressures and costs incurred from the ongoing organisational restructuring. Analysts expect a 10% to 16% net profit growth in rupee terms and 40 to 70 basis points fall in operating margins despite the depreciation of rupee, which fell over 10% against the US dollar during the July-September period.

Since returning to the company he co-founded with six others in 1981, Murthy has sought three years to rebuild a "desirable" Infosys.
Under Murthy, Infosys has been cutting costs in overseas work locations and focusing more on winning deals in traditional areas such as software development and managing IT infrastructure for large corporations After his return the company has seen several senior executives leaving the company, including North America head Ashok Vemuri and global sales chief Basab Pradhan.

The fall in rupee has been seen as a big positive for the Indian IT sector. The currency may have recovered from the lows of just about 69, but it has lost too much in too short a period, and is much below the levels seen not too far back. Good for the IT sector, analysts have been crying since long. Particularly talking about Infosys, the now-disputed poster boy of the Indian IT sector; the company would be announcing its keenly awaited Q2 results tomorrow.

So lets see what Technical Says :-

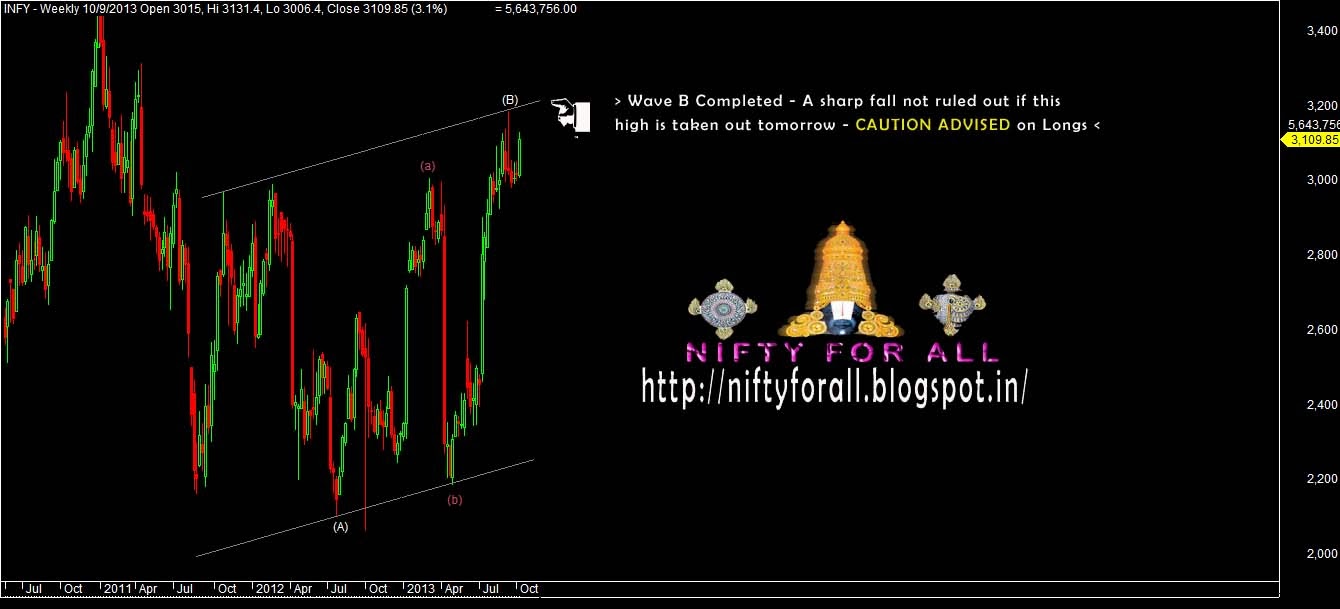
>>> Weekly Chart - INFY <<<

>>> Click the chart to see on full screen <<<

Weekly Chart shows Wave B has almost comleted and Wave C may start any time. Means a fall waiting on card. Lets see in details on Hourly Chart how the last upmove has been done.

>>> Hourly Chart - INFY <<<

>>> Click the chart to see on full screen <<<

As gap Up seen on Hourly chart was done after Narayana Murthy's re-entry on board. So its an extension as a-b-c-d-e. Right now the upmove looks like almost completed.
For tomorrow - Recent high 3188 - top looks very crucial. I hope its the end of wave B. If not taken out then Wave C must start and a fall not ruled out. Caution advised.

>>> NIFTY <<<

>>> Click the chart to see on full screen <<<

Nifty had a very choppy session today. No change in view, still 6048 is not taken out. So lets wait for direction.

Wednesday, October 09, 2013

Caution Advised ...!!!

Dear All,

>>> Click the chart to see on full screen <<<

Yes I advice Caution as Nifty is nearing 6048. So as per current Scenario its seems Nifty may move as a-b-c-d-e or a-b-c. On either case 6048 should resist. Lets See.

>>> BANK NIFTY <<<

>>> Click the chart to see on full screen <<<

Bank Nifty also facing resistance as shown on chart. If unable to cross the resistance line may see a sharp sell off. Lot of possibilities to fill the gap left on the down side. Caution advised.

Tuesday, October 08, 2013

Range between 5922 & 5974

Dear All,

>>> Click the chart to see on full screen <<<

Nifty range between 5922 and 5974. Break any of these level may decide the direction.