Pages

Sunday, August 10, 2014

Weekly Review - 11.08.2014

Dear All,


Nifty ended lower for the second straight week tracking a sell-off in global equities amid rising tensions between Ukraine and Russia and after US President Barack Obama authorised air strikes in Iraq. On the domestic front, rising crude oil prices raised fears of further widening of fiscal and current account deficits while Reserve Bank of India's neutral stance on key policy rates flagging inflation concerns also weighed on investor sentiment in the week to August 8.

President Barack Obama said Saturday. At a news conference, Obama also repeated previous statements that no U.S. ground troops would be committed to the fight against the Islamic State, that a fully functional Iraqi government is necessary and only Iraqis can solve their problems, adding: "Ultimately, there's not going to be an American military solution to this problem."

On Tuesday the government will release industrial production data for June 2014 and WPI inflation data for July while on Thursday data on CPI inflation for July will be released.

>>> Nifty - Daily Chart <<<

>>> Click the chart to view on full screen <<<


Price Broken 50dma. Expanding Triangle shows support @ 7390-7400. Lets see more on Hourly chart also with different angle.

>>> Nifty - Hourly Chart - As Posted Last Thursday <<<

>>> Click the chart to view on full screen <<<


Wrote last Thursday - 7638 as a crucial support. We have also send sms to our clients about a possible for of 100 points with a Sell Call on Nifty - See what happened.

>>> Happened and Yet to <<<

>>> Click the chart to view on full screen <<<


Yes our Target achieved 7565 with a profit of 135 point. Now as per above chart we expect nifty to move upward before next fall. Yes no doubt we are on Long in nifty now. Lets See.

>>> Bank Nifty - Daily Chart <<<
>>> Click the chart to view on full screen <<<

Bank Nifty on a A-B-C formation - Lot of possibilities visible and hence the arrow mark drawn on chart may be useful to find out the trend. Interesting action left on chart. Lets See.

>>> Last Week's Chart Performance <<<

>>> Unitech - As Posted on 04th Aug, 2014 <<<

>>> Click the chart to view on full screen <<<


Wrote on 04th Aug, 2014 to Buy Unitech. See what happened.

>>> Unitech - Happened <<<

>>> Click the chart to view on full screen <<<


Made a high of 28.35 and we advised to book near 28.

>>> Jindal Steel - As posted on 05th Aug, 2014 <<<

>>> Click the chart to view on full screen <<<


Said - Jindal Steel on break and advised to go Long. See what happened.

>>> Jindal Steel - Happened <<<

>>> Click the chart to view on full screen <<<


Second Target of 290 achieved with a profit of Rs.15000.

>>> Performance - As on 08th August, 2014 <<<

>>> Click the chart to view on full screen <<<


For more information, kindly send email to niftyforall@yahoo.com

Thursday, August 07, 2014

Support @ 7638

Dear All,

>>> Click the chart to view on full screen <<<
One more volatile day - We booked our long and again shorted nifty, which earned as almost 100 points in a day.

So now 7638 looks very crucial support - and looks like an head and shoulder formation, if breaks - then free fall on the week end day tomorrow. Caution advised.

>>> JINDALSTEL - As Posted on 05th August, 2014 <<<

>>> Click the chart to view on full screen <<<
Wrote on 05th August about Jindal Steel - as a Long candidate..See what happened.

>>> Happened <<<

>>> Click the chart to view on full screen <<<
Second Target got completed @ 290 with a profit of around 15000.

>>>

Wednesday, August 06, 2014

Support @ 7655 & 7628

Dear All,

>>> click the chart to see on full screen <<<

its a complicated correction with abc-x-abc and so on. 7655 and 7628 seems to be a support and if holds expect a bounce again. Else fall may continue.

Tuesday, August 05, 2014

Resistance 7760 & 7790

Dear All,

>>> Click the chart to see on full screen <<<

We have booked yesterday Nifty buy Call near 7714 and re-entered again @ 7640. Almost Booked with 100 Points Profit on intraday itself.

Tomorrow if 7760 and 7790 - resists and unable to cross may invite selling again.

>>> UNITECH - As Posted Yesterday <<<

>>> Click the chart to see on full screen <<<

Yesterday we wrote to Buy Unitech.. See what happened.

>>> Happened and yet to <<<

>>> Click the chart to see on full screen <<<

As expected Stock Zoomed and we made a Part Booking of Rs.34000. Still looks potential for more upside.

>>> JINDALSTEL <<<

>>> Click the chart to see on full screen <<<

We have already booked a partial Profit of Rs.5000. Good Break out on chart - suggest more upside. Lets See. Cheers!!!

Monday, August 04, 2014

Resistance 7700 & 7714

Dear All,

>>> Click the chart to see on full screen <<<

Highly Complex correction as abc-x-abc and possibly it may continue again as -x-abc. Hence nifty on the grip of volaile and choppy too.

We had a Buy call on friday and booked a partial profit @ 7670. So tomorrow if 7700 - not able to cross then again - volatile to continue. Lets wait and see.

>>> UNITECH <<<

>>> Click the chart to see on full screen <<<

Unitech - chart suggest a clear break out, and if able to hold above the trend line - expect a good rally. So just keep buying. Cheers!!!

Saturday, August 02, 2014

Weekly Review - 04.08.2014

Dear All,

Dear All,

Indian Stocks Market and the rupee fell on Friday due to fears of a decline in global money flows if the US, the world's biggest economy, increases interest rates. The prospects of Argentina's second default in 13 years having a negative knock-on effect on money and stock markets also weighed on global shares, sending them lower

FIIs dumped shares worth about 1,070 crore on Friday, extending their selling to the third straight day, despite the country's manufacturing sector growing at its strongest pace in 17 months in July.

Finance Ministry is confident of achieving minimum 5.5 percent GDP in FY15, quoting government sources. In fact, the government is hoping to achieve a full year GDP closer to the 6 percent level. The confidence is based on the recent positive economic data, like June core sector and IIP growth figures. It is also taking heart from the fact that monsoon has not been bad as has been envisaged earlier. But it’s not just the eight core sectors, which have recorded good growth, but signs of a broad-based recovery happening are clearly visble. For example, the auto sales numbers have shown a significant pick up.

So what else pending on Technicals...Lets See.

>>> Rupee Vs Dollar - As Posted on 21st June, 2014 <<<

>>> Click the chart to see on full screen <<<

Have posted INR Vs Dollar - on 21st June 2014. Wrote clearly that Price ready to bounce.. See what happened.

>>> Happened and Yet to <<<

>>> Click the chart to see on full screen <<<

As Expected started Price started moving up. So its going to be a lot of changes on the entire market and get ready for more and more fire works.

>>> Nifty - Daily Chart <<<

>>> Click the chart to see on full screen <<<

So after a heavy volatile and fall last week, nifty now looking dangerous. If 50 dma breaks then we should be very cautious. Expanding triangle is another worry - if breaks then deep corrections are the possibilities.

>>> Nifty - Hourly Chart <<<

>>> Click the chart to see on full screen <<<

On the contrary - lets look at the bulls side also. On hourly chart - it looks like abc-x-abc fall looks completed. So 7600 and 7560 support holds - then possible bounce back are high.

>>> Performance - Chart - Last Week <<<

>>> ORIENTBANK <<<

>>> Click the chart to see on full screen <<<


>>> ANDHRABANK <<<

>>> Click the chart to see on full screen <<<


>>> Special Coverage - HINDUNILVR <<<

>>> Click the chart to see on full screen <<<

Hindustan UniLever - Charts looks Bearish now and we recommend to sell on Rise. Just Sell and Hold for a deep correction.

As per chart - Stock took almost 1 year for A & B Wave consolidation - which means Wave C on the down side to start any time for a deep fall.

Sell and Earn - Cheers!!!

Thursday, July 31, 2014

Support @ 7707 & 7670.

Dear All,

>>> Click the chart to see on full screen <<<

Turning down again - shows nifty moving down as abc-x-abc. Now the supports are 7707 previous low and 7670 where there is a small gap left. So lets wait and see.

>>> INFY <<<

>>> Click the chart to see on full screen <<<

Just Sell if breaks the channel - Sell and Earn. Cheers!!!

Wednesday, July 30, 2014

7707 Supported

Dear All,

>>> click the chart to see on full screen <<<

FnO Expiry tomorrow. Fed will release its policy decision today night as US economic data and the two-day US FOMC meet which ends today.

Nifty took support @ 7707, where as nifty fall was marked as abc. Hence tomorrow may be the trend decider. So lets wait and watch.

Monday, July 28, 2014

The CAT still on the WALL.

Dear All,


A top-ranking North Korean military official has threatened a nuclear strike on the White House and Pentagon after accusing Washington of raising military tensions on the Korean peninsula.

The threat came from Hwang Pyong-So, director of the military's General Political Bureau, during a speech to a large military rally in Pyongyang yesterday on the anniversary of the armistice that ended the 1950-53 Korean War.

Hwang, who holds the rank of vice marshal in the Korean People's Army, said a recent series of South Korea-US military drills, one of which included the deployment of a nuclear- powered US aircraft carrier, had ramped up tensions.

It is not the first time that North Korea's bellicose rhetoric has included threats of nuclear strikes on the continental United States and US bases in the Pacific.

But most experts believe it is still a long way from developing a viable intercontinental ballistic missile with the required range.

The North has conducted three nuclear tests, but is not thought to have mastered the miniaturisation techniques necessary for mounting a warhead on a missile.

It does possess a range of short-and mid-range missiles capable of striking South Korea and Japan, and has conducted a series of test firings into the Sea of Japan (East Sea) in recent weeks.

The latest test on Saturday - guided by the leader Kim Jong-Un - simulated a short-range missile strike on South Korea where 28,500 US troops are stationed, the North's state media said.

>>> NIFTY <<<

>>> click the chart to see on full screen <<<

Lot of alternatives visible on chart now. Hence the Cat is still on the wall. Need to wait and watch. So lets wait.

Saturday, July 26, 2014

Weekly Review - 28.07.2014

Dear All,


Out Look for Next Week :-

The Nifty gave a breakout from the 1000-1050 point rising channel once it crossed 6850 in May 2014 before the election results on very good volumes.

Volumes rose sharply thereafter and the Nifty made a high of 7,563 on the day of the election results. After a retracement up to 7120 odd level, the index resumed the uptrend and went on to make a high of 7809 and on Friday it made a fresh record high of 7840.95.

Last Week volumes have dipped in comparison to the prior up-moves. Most of the midcap stocks have failed to participate in the latest rally while a handful of them have actually corrected sharply.

According to most analysts, the hope-based rally is largely over and the markets are likely to consolidate in the near term, but the broader trend for the market largely remains on the upside.


India is the only big emerging economy to escape a cut in the International Monetary Fund's update of its World Economic Outlook that says the global economy seems to have tripped on an unexpected contraction in the US economy in the first quarter, which is a welcome sign.

IMF has retained its forecast of 5.4 per cent growth in the Indian economy in 2015 and a stronger 6.4 per cent growth next year.

Although macro-economic data such as IIP, inflation data points the needle in the right direction, but earnings growth for India Inc is still some quarters away, say analysts.

So lets go to Technicals and see what the Charts Says ....

>>> Nifty - Daily Chart <<<

>>> click the chart to see on full screen <<<

If the above count is not wrong - then expect nifty to perform till or above 8000. Lets see one more probability also.

>>> Alternative Nifty view on Daily Chart <<<

>>> click the chart to see on full screen <<<

of course its a expanding triangle - price got resisted on the top of it. So if Price fails to cross the channel - price may reach till then below channel as shown on chart.

>>> Bank Nifty <<<

>>> click the chart to see on full screen <<<

Nothing more to say than in chart. Lets wait and see.

>>> PERFORMANCE till 25th July 2014 <<<

>>> click the chart to see on full screen <<<

Please contact niftyforall@yahoo.com for details.

Thursday, July 24, 2014

Crossed 7809

Dear All,

>>> Click the chart to see on full screen <<<

So 7809 crossed as expected. But broader market looks weak with lot of volatile and choppiness. Looks very difficult to trade, as either side may hit stop loss.

>>> JP Associates - As posted Yeterday <<<

>>> Click the chart to see on full screen <<<

Yesterday we recommend to Buy JP Associates - Hit Stop Loss today. After the news of Taqa India Power Ventures withdraw from their acquisition agreement, price fell down to hit stop loss.

Lets see what to happen next ..??

>>> Yet to Happen <<<

>>> Click the chart to see on full screen <<<

If 61.4 and 61.8 holds tomorrow - then expect a good bounce. Let's See. Cheers!!!

Wednesday, July 23, 2014

7809 - Resisted

Dear All,

>>> click the chart to see on full screen <<<

As wrote Yesterday - 7809 resisted - Until we cross this hurdle - Market going to be choppy and volatile. So the most frequently asked questions like - Was the market Topped Out ???? - The answer is - still no valid trigger or break down for such correction - FII's are still on buying spree. Hence shorting is not advisable at this point. Remain Long at this point with proper stop loss is advisable. Due to high volatile - Some Trade may hit Stop loss - are unavoidable.

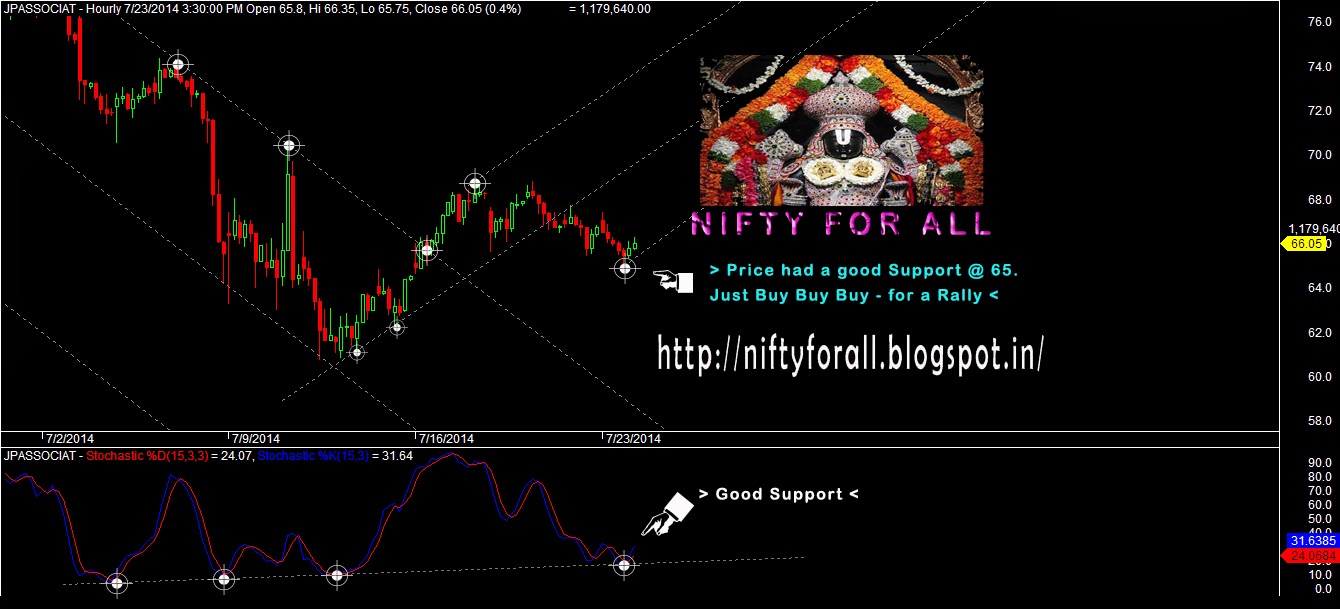
>>> JPASSOCIATES <<<

>>> click the chart to see on full screen <<<

Stock looks very attractive - with a good support @ 65. Just Buy for good Rally.

>>> BIOCON - As Posted Yesterday <<<

>>> click the chart to see on full screen <<<

Wrote Yesterday about Break out on Biocon.. Let's See what happened.

>>> Happened and Yet to <<<

>>> click the chart to see on full screen <<<

We had a Part Booking at 522 or 61.8% fib level for Rs.5000. Lets See. Cheers!!!

Tuesday, July 22, 2014

Final Hurdle @ 7809

Dear All,

>>> Click the chart to see on full screen <<<

No doubt many are frustrated by the volatility on Market. Many forced to went short or may have purchased PUT Options. So above chart is the answer for all your troubles and loss. Yes we are in the Last Leg of upmove. The nature of this Last leg should be volatile in nature. One should buy on every dips and must avoid Shorts. Must trade with lot of patience.

>>> Nifty - Hourly Chart - Posted on 18th July 2014 <<<

>>> Click the chart to see on full screen <<<

On Last weekly review wrote clearly - about the Moving Average Cross over and 7661 Resistance. See what happened today.

>>> Happened <<<

>>> Click the chart to see on full screen <<<

Its a good rally today. Finally Nifty facing hurdle at all time high of 7809. So lets wait and see.

>>> DR.Reddy's Lab - As posted on 17th July 2014 <<<

>>> Click the chart to see on full screen <<<

We told to Buy Dr.Reddy's Lab on 17th July. See what happened today.

>>> Happened and Yet to <<<

>>> Click the chart to see on full screen <<<

First target met with a profit of Rs.7625. Price made a high of 2733 - More rally on card.

>>> BIOCON <<<

>>> Click the chart to see on full screen <<<

No doubt we are long in this counter from 512 onwards. Clear break out shows more rally possible. Just buy and enjoy. Cheers!!!