Pages

Saturday, July 25, 2015

Weekly Review - 27.07.2015

Dear All,

>>> Nifty Daily Chart <<<

>>> Click the chart to see on full screen <<<

A Picture is better than 1000 Words. Hope the above chart says you all the story - you are missing so far. Price retraced towards the neck line of the Head and shoulder. If this is not wrong - then Market is in great danger. Expect the unexpected fall and news to come out soon. Caution


>>> Bank Nifty Daily Chart <<<

>>> Click the chart to see on full screen <<<

Same as above nifty. So far the Wave X completed as a-b-c-d-e. If this is not wrong - worst is yet to come. If able to break above the key resistance 19230 or above, rally to continue. Caution again.

>>> ULTRACEMCO - As posted on 20th July, 2015 <<<

>>> Click the chart to see on full screen <<<

As Posted on Chart.

>>> GLENMARK - Posted on 20th July, 2015 <<<

>>> Click the chart to see on full screen <<<

Posted on 20th July - Glenmark about the possible correction. See what happened.

>>> GLENMARK - Happened <<<

>>> Click the chart to see on full screen <<<

Expecting the fall to continue - in coming days also.

>>> SIEMENS - Posted on 20th July, 2015 <<<

>>> Click the chart to see on full screen <<<

Siemens - Wrote - for a possible correction. See what happened.

>>> SIEMENS - Happened <<<

>>> Click the chart to see on full screen <<<

First Target met @ 1440 with a Profit of Rs.12500. Still look for the fall to continue.

>>> DISHTV - Posted on 21st July, 2015 <<<

>>> Click the chart to see on full screen <<<

It was a Intraday Profit of Rs.12000. Lets see whats next ??

>>> DISHTV - Whats next <<<

>>> Click the chart to see on full screen <<<

Negative divergence on Indicators while Price continue to move up. Stay caution at higher level. Both Price and RSI - if breaks the trend line as shown on chart - correction may start.

>>> PERFORMANCE till 24th July, 2015 <<<

>>> Click the chart to see on full screen <<<

Send your email to niftyforall@yahoo.com - for more details.

Thursday, July 23, 2015

Resisted @ 8654. Support @ 8540,8500,8470 & 8420

Dear All,

>>> Nifty Hourly Chart <<<

>>> Click the chart to see on full screen <<<

So the top most trend line is still unbreakable - shows more consolidation ahead. Possible Support may be 8540,8500,8470 and 8420.

>>> TATAMOTORS - Hourly <<<

>>> Click the chart to see on full screen <<<

If the Price stays above the break out channel - initial target may test the next channel as shown on chart. Cheers!!!

Resistance @ 8650 & 8680 - More Rally above this level

Dear All,

>>> Nifty Hourly Chart - Posted Yesterday <<<

>>> click the chart to see on full screen <<<

Wrote yesterday - rally possible again - said still possible to rest 8680. See what happened.

>>> Nifty Hourly Chart = Happened <<<

>>> click the chart to see on full screen <<<

As exected - Rally started again. More rally above 8680 possible. Cheers!!!

Tuesday, July 21, 2015

Support 8561 Broken - But still Hope is there !!!

Dear All,

>>> Nifty Hourly Chart <<<

>>> Click the chart to see on full screen <<<

Nifty - not moving up as expected. Resistance 8680 still not yet reached. Channel remains a good support, unless it breaks - Price may try to reach 8680 again. Lets See.

>>> GLENMARK- As posted Yesterday <<<

>>> Click the chart to see on full screen <<<

Wrote yesterday - If price unable to cross the channel - may correct heavily. See what happened.

>>> GLENMARK - Happened <<<

>>> Click the chart to see on full screen <<<

As expected - Price unable to cross the channel resistance, started correcting heavily. We made some part profit of Rs.11750. Expecting more such correction towards our target.

>>> SIEMENS - As Posted Yesterday <<<

>>> Click the chart to see on full screen <<<

Wrote yesterday - Price may correct - unless price able to cross the channel as shown above.

>>> SIEMENS - Happened <<<

>>> Click the chart to see on full screen <<<

As expected Price fell down - we made a good profit of Rs.10,000/-

>>> DISHTV <<<

>>> Click the chart to see on full screen <<<

We Shorted @ 117 and made Rs.12000 Profit on Intraday itself. As mentioned on chart 119 act as a key resistance. Unable to cross may trigger more such correction. Cheers!!!

Monday, July 20, 2015

Support Holds @ 8561

Dear All,

>>> Nifty Hourly Chart <<<

>>> Click the chart to see on full screen <<<

As said Support 8561 holding.

>>> ULTRACEMCO - Posted on Weekly Review <<<

>>> Click the chart to see on full screen <<<

Wrote on Weekly review about Ultra Tech Cement.

>>> ULTRACEMCO - Happened <<<

>>> Click the chart to see on full screen <<<

So after making an profit - fall till 3211 - Price reversed after Results. Hit SL at 3275. Exited.

>>> GLENMARK <<<

>>> Click the chart to see on full screen <<<

If the channel top - continue to resist, then fall may start. Else price may continue to rally. We have short position on this stock.

>>> SIEMENS <<<

>>> Click the chart to see on full screen <<<

Channel got resisted and if price continue to stay below the channel - selling and fall may emerge. Cross above the channel may trigger rally. Cheers!!!

Sunday, July 19, 2015

Weekly Review - 20.07.2015

Dear All,

Nifty and Bank Nifty got their break out above 8561 & 18980 respectively. Last Week's Weekly Bearish Candle Stick on Nifty got negated. Hence look for some more rally on Index next week also. But the structure still looks like an retracement which might be an complex one, hence it looks like an extending nature. So the stocks are not performing and maintaining their choppiness and volatile.Its safe for the aggressive traders and investors to stay on the side line or to stay caution for the time being.

On the international front Greece and Iran Deal almost finalized. China still looks scary. All these factors may impact crude heavily and which might be a positive sign for India.

Monsoon and Results are the domestic triggers. Rupee and crude movement looks very important. Parliament Session - Yet to decide on GST and Land Bill soon. BJP suddenly dipped with Scam news may rock the parliament and govt. may find it difficult to pass any such bills may heavily impact our equity market also.

So lot of Triggers still waiting on the side line. Lets go to technicals.
>>> Nifty Daily Chart <<<

>>> Click the chart to see on full screen <<<

Daily Chart suggest 8738.

>>> Nifty Hourly Chart <<<

>>> Click the chart to see on full screen <<<

Hourly Chart suggest 8680, 8738 and 8810-15.

>>> Bank Nifty Daily <<<

>>> Click the chart to see on full screen <<<

Next Resistance @ 19480.

>>> Bank Nifty Hourly Chart <<<

>>> Click the chart to see on full screen <<<

As given on chart.

>>> HINDUNILVR - Posted on 13th July - Weekly Review <<<

>>> Click the chart to see on full screen <<<

We had a short on HLL and price fell down to 890 from 912. Had a part profit of Rs.5000 also. See what happened next.

>>> HINDUNILVR - Happened <<<

>>> Click the chart to see on full screen <<<

Exited above 933. Still the stock looks bearish, though we have waited too much and exited.

>>> APOLLOHOSP - As Posted on 20th June - Weekly Review <<<

>>> Click the chart to see on full screen <<<

Have advised our clients to short Apollo Hospital. See what happened.

>>> APOLLOHOSP - Happened <<<

>>> Click the chart to see on full screen <<<

Exited and Booked Loss.

>>> ULTRACEMCO <<<

>>> Click the chart to see on full screen <<<

We have position in Ultracemco - Please consult your advisors before taking any position.

>>> Performance - till 17th July, 2015 <<<

>>> Click the image to see on full screen <<<

Please email us on niftyforall@yahoo.com for details of our service.

Thursday, July 16, 2015

Next Resistance @ 8690

Dear All,

>>> Nifty Daily Chart <<<

>>> Click the chart to see on full screen <<<

Price crossed 8558 or 8561. Next Resistance at 8690.

>>> HINDUNILVR <<<

>>> Click the chart to see on full screen <<<

We have exited Short on HLL above 933. Short advised from 912 and earlier we made some part profit at 890. Still now looks like the fall can resume if the previous high is not crossed. Lets wait and see. Cheers!!!

Wednesday, July 15, 2015

Cat on a Wall

Dear All,

>>> Nifty 5 Mins Chart <<<

>>> Click the chart to see on full screen <<<

This chart was send today on whatsup during trading hours. Today Price closed above 78.6% or 8508. Tomorrow if price able to trade above 8561 - rally to continue.

>>> Bank Nifty Hourly Chart <<<

>>> Click the chart to see on full screen <<<

Hope the above picture says the story. Key resistance 18940 must cross for a good rally. Else price may test the two supports as shown on chart.


Tuesday, July 14, 2015

Resisted @ 8467. Caution Advised

Dear All,

>>> Nifty Hourly Chart <<<

>>> Click the chart to see on full screen <<<

As wrote Yesterday - Nifty unable to cross above 8467-68, got resisted. If not tomorrow also, Fall may resume.

>>> Bank Nifty Hourly Chart - Posted on Weekly Review <<<

>>> Click the chart to see on full screen <<<

Above Chart - Posted on Weekly Review - See what happened.

>>> Bank Nifty Hourly - Happened <<<

>>> Click the chart to see on full screen <<<

After filling the gap - Price moved up a bit. But unable to cross the pitchfork - Stay Caution.

Monday, July 13, 2015

Resistance @ 8467 & 8508

Dear All,

>>> Nifty Hourly Chart <<<

>>> Click the chart to see on full screen <<<

Greek Deal helped the bulls to fill the gap left on the upper side. Two resistance 8467 or 8508 must be crossed for more rally.

>>> HINDUNILVR - Follow Up <<<

>>> Click the chart to see on full screen <<<

Its a follow up - for our earlier call. Price may resist as shown on chart. Fall may resume any time - if the price unable to cross the given levels.

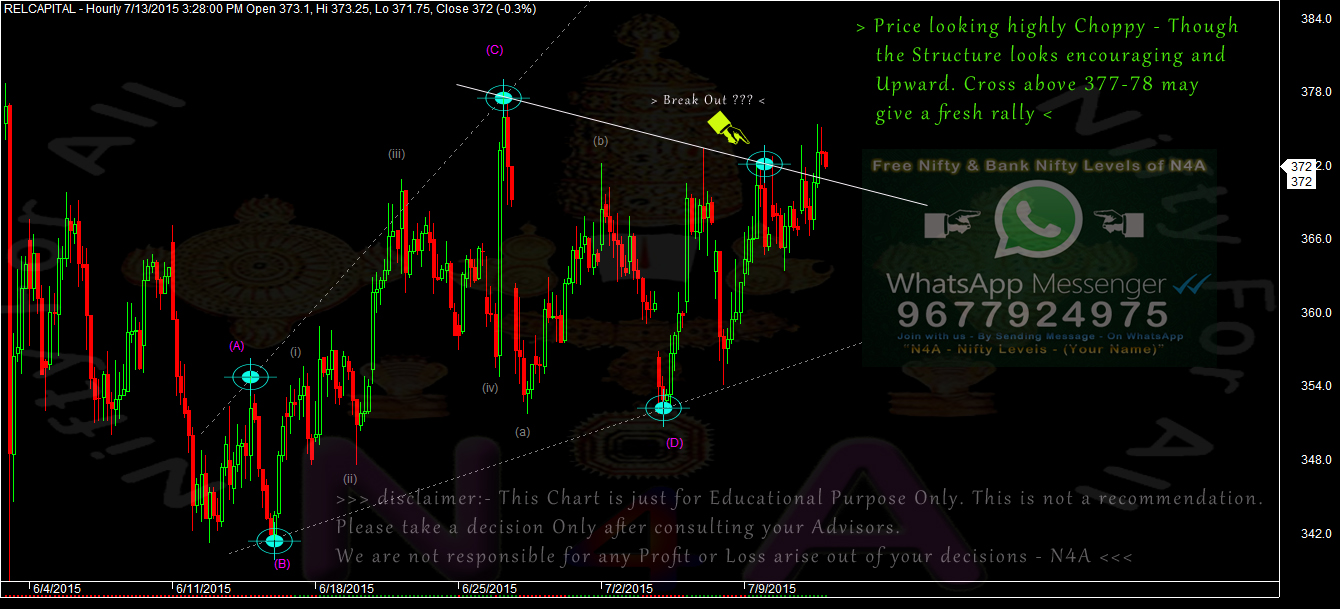
>>> RELCAPITAL <<<

>>> Click the chart to see on full screen <<<

Above 377-78 - Price may rally. Lets See. Cheers!!!

Saturday, July 11, 2015

Weekly Review - 13.07.2015

Dear All,

>>> Nifty Weekly Chart <<<

>>> click the chart to see on full screen <<<

Its a Spinning Top Candle Stick. Price almost Touched 50WMA. May be its a reversal Sign. If trades below 50WMA - Bear may take Advantage. Caution Advised.

>>> Nifty Daily Chart <<<

>>> click the chart to see on full screen <<<

Wave X completed as ABC - which was resisted @ 50% retrace near 8558 or 8561. Hence the count and pattern shows unhealthy for bulls. It looks like a Sell on rise.

>>> Nifty Hourly Chart <<<

>>> click the chart to see on full screen <<<

Its a clear support at 8320 after completing a 1-5 rally till 8561. Below 8320 - Price may see 8190-85 level.

>>> Bank Nifty Daily Chart <<<

>>> click the chart to see on full screen <<<

Like Nifty Bank Nifty also completed Wave X as abcde. Until channel holds the price below, Price may remain under pressure form Bears. Cross above the channel may favour Bulls.

>>> Bank Nifty Hourly Chart <<<

>>> click the chart to see on full screen <<<

Price retraced on friday may get resisted on the lower trend line of the pitchfork. Almost the Gap also filled. Unable to cross above Friday high may trigger sell off.

>>> HINDUNILVR - Posted on 09th July, 2015 <<<

>>> click the chart to see on full screen <<<

Wrote - Price may correct move if stays below the wedge. See what happened.

>>> HINDUNILVR - Happened <<<

>>> click the chart to see on full screen <<<

As expected - Price started falling below the wedge. More such fall expected. Cheers!!!