Pages

Sunday, September 11, 2016

Weekly Review - 12th September, 2016

Dear All,


The sentiments are bullish everywhere, although high valuation concerns are there all over the Street. Foreign portfolio investors (FPIs) have invested Rs 2,121 crore so far in September while domestic institutional investors (DIIs) have had net redemptions to the extent of Rs 110 crore, an indication that domestic investors are still not convinced about the India story.

Surprisingly only 48 lakh active clients had traded last week on any single day, which is too microscopic when seen from the country's demographic perspective. No wonder the depth in the Indian market is so shallow, which is why any concerted selling by FPIs results in a massive price erosion in stocks.

New Reserve Bank of India Governor Urjit Patel is likely to continue with the neutral stance on liquidity that the central bank adopted in April under Raghuram Rajan and this will play a key role in the transmission of rate cuts, suggest experts.

Ensuring adequate liquidity via open market operations (OMO) is clearly on top of the agenda of the new RBI governor. RBI will conduct open market operations (OMO) on Thursday to purchase government bonds to infuse about Rs 10,000 crore liquidity.

OMO stands for an open market operation, which is conducted by RBI. The central bank conducts OMO by way of sale or purchase of government securities to or from the market with an objective to adjust rupee liquidity conditions in the market on a durable basis.

If there is excess liquidity, RBI resorts to sale of securities and when liquidity conditions get tighter, RBI buys securities from the market.

Nifty Weekly chart formed a Inverted Hammer. While some experts turned cautious, others believed one should not read too much into Friday's trading pattern and the view of buy-on-dips market remains intact.

"I do not think we should read too much into this trend. It is after all just a readjustment of the weekly trends. We have managed to hold on to the gains that we built in during the week, giving up a little bit towards the end of the week. My expectation is that the weak hands are probably getting bailed out or being forced to bail out and they will be back in action next week," said CK Narayan, Founder, Chart Advise.

So more to watch on Trend - before taking a firm decision. Lets See technicals...

>>> Nifty Weekly Chart <<<

>>> Click the chart to see on full screen <<<

After many weeks - Price showing a Inverted Hammer - Possibly It may be a trend reversal also. Caution advised.

>>> Nifty Daily Chart <<<

>>> Click the chart to see on full screen <<<

Looks like ABC completed, and if not wrong, Expect some good correction soon.

>>> Nifty Hourly Chart <<<

>>> Click the chart to see on full screen <<<

Above hourly chart suggest - Price topped out on the expanding triangle, hope a fall is unavoidable.


>>> Bank Nifty Daily Chart <<<

>>> Click the chart to see on full screen <<<

Bank Nifty - Above counts - Looks like - completed ABC upmove. But due to the complex nature of the wave - we need to still wait for some more confirmation on either side to decide any action.

>>> Bank Nifty Hourly Chart <<<

>>> Click the chart to see on full screen <<<

Last leg of rally - tested the channel top of pitchfork. Looks like Bulls getting tiered and need to confirm the bears entry with more confirmation.

>>> SBIN - Possible Correction <<<

>>> Click the chart to see on full screen <<<

We have short position on SBI, looking for a good correction.

>>> ADANIPORT - Possible Correction <<<

>>> Click the chart to see on full screen <<<

We have short position on Adani Port, Looking for a good correction.


Wednesday, September 07, 2016

Resisted @ 8950

Dear All,

>>> Nifty Hourly Chart <<<

>>> Click the chart to see on full screen <<<

Unable to hold above 8950 and RSI broken the Trend line shows some weakness.

Tuesday, September 06, 2016

Resistance @ 8950

Dear All,

>>> Nifty Daily Chart <<<

>>> Click the chart to see on full screen <<<

8950 Key Resistance - If crosses - More rally till 9060.

>>> Bank Nifty Hourly Chart <<<

>>> Click the chart to see on full screen <<<

Bank Nifty facing resistance @ 20430-460, Cross above see more rally. Cheers!!!

Sunday, September 04, 2016

Weekly Review 06th September, 2016

Dear All,


The market may see positive opening on Tuesday after data showed slower growth in US non-farm payrolls in August, which have reduced the chances of a Fed rate hike in the near future. Non-farm payrolls in US rose by 1.51 lakh in August against 2.75 lakh in the previous month, with weakness visible in construction and manufacturing sector hirings. The numbers came in lower than 1.8 lakh jobs anticipated in a Reuters' poll.

All eyes would be on Urjit Patel, the new RBI Governor, who will take charge from Raghuram Rajan on Tuesday. Any comment by the new governor on inflation and banks' asset quality would influence the market mood.

Manufacturing PMI readings in China and similar data in Europe will be keenly tracked on Monday.

The European Central Bank's policy decision on benchmark interest rate and Japanese GDP numbers will be released on Thursday. Chinese CPI and PPI readings and back home industrial production and manufacturing output data for July will sway the market sentiment on Friday.


>>> Nifty Weekly Chart <<<

>>> Click the chart to see on full screen <<<


Price crossed above first hurdle and may test second hurdle 8844. Above 8844 - More rally and fresh high possible.

>>> Nifty Daily Chart <<<

>>> Click the chart to see on full screen <<<


After getting support @ 8540, RSI made a fresh break out and rally with Price shows the Strength.

>>> Nifty Hourly Chart <<<

>>> Click the chart to see on full screen <<<


Price and RSI on the Trend line support must help the bulls to rally.

>>> Bank Nifty Daily Chart <<<

>>> Click the chart to see on full screen <<<


Price if holds above the channel as shown on chart - more upmove possible.

>>> Bank Nifty Hourly Chart <<<

>>> Click the chart to see on full screen <<<


Bank NIfty may test 20050 or 20150 near the channel top as shown on chart.

>>> BHARTIARTL - Expecting a Bounce <<<

>>> Click the chart to see on full screen <<<


After some heavy sell off on RIL AGM Day's - JIO Announcement - Price looking for a possible bounce as shown on chart. We are long and expecting some rally soon.

>>> LUPIN - Possible Upmove <<<

>>> Click the chart to see on full screen <<<


LUPIN may bouce if price holds the channel support as shown above. We are long and expecting a bounce from here.


>>> Performance for the month end of August, 2016 <<<

>>> Click the image to see on full screen <<<


Above performance is not a Promise or guarantee for the given Profits or Loss.Performance given based on 1 lot at a time and clients Profit differ as per the margin availability and Number of Lots taken by them. We may or may not re-enter the Calls given here hit Stop Loss, as per market movement. The charts given above are just for educational purpose only and we don't recommend any Entry / Buy or Exit / Sell. Reader must taken their own decision or consult their qualified Analyst before making any decision.

Thursday, September 01, 2016

Below 8750 May test 8720

Dear All,

>>> Click the chart to see on full screen <<<

If breaks 8750 - May test 8720 - Next Support. We have booked just 40 Points today. Voltaile may continue again.


Wednesday, August 31, 2016

Support @ 8750 & 8720

Dear All,

>>> Nifty Hourly Chart <<<

>>> click the chart to see on full screen <<<

8750 & 8720 acts as a good support. Cheers!!!

Tuesday, August 30, 2016

Must Cross 8750 for 8805 & 8875

Dear All,

>>> Nifty Hourly Chart <<<

>>> Click the chart to see on full screen <<<

Price need to hold above 8750 for fresh rally. Cheers!!!

Monday, August 29, 2016

Support @ 8540 & 8490

Dear All,

>>> Nifty Daily Chart <<<

>>> Click the chart to see on full screen <<<

Price tested the trend line and made a bounce back. So 8540 & 8490 must break for a correction, Till then market may remain volatile again.

>>> Bank Nifty Hourly Chart - Posted on Weekly Chart <<<

>>> Click the chart to see on full screen <<<

Wrote on Weekly Review - BN support @ 19130 & 19030.

>>> Bank Nifty Hourly Chart - Happened <<<

>>> Click the chart to see on full screen <<<

100 Hma - Supported bulls and 19130 and 19030 continue remain as a good support. Cheers!!!

Sunday, August 28, 2016

Weekly Review - 29th August, 2016

Dear All,


The case for raising US interest rates has strengthened in recent months because of improvements in the labour market and expectations for moderate economic growth, Federal Reserve Chair Janet Yellen said on Friday.

Yellen did not indicate when the US central bank might raise rates, but her comments reinforced the view that such a move could come later this year. The Fed has policy meetings scheduled in September, November and December.

Speaking at a three-day international gathering of central bankers in Jackson Hole, Wyoming, Yellen said the “US economy was nearing the Federal Reserve’s statutory goals of maximum employment and price stability.”

“In light of the continued solid performance of the labour market and our outlook for economic activity and inflation, I believe the case for an increase in the federal funds rate has strengthened in recent months,” Yellen said in prepared remarks.

She added that the Fed still thinks future rate increases should be “gradual.”

The Fed raised rates in December, its first hike in nearly a decade, but it has held off further increases so far this year due to a global growth slowdown, financial market volatility and generally tepid US inflation data.

Investors currently see an 18% probability the Fed will raise rates at its September policy meeting and a 53% chance of an increase in December, according to CME Group’s FedWatch tool.


India’s 10-year sovereign notes completed their first weekly drop in three weeks as Urjit Patel’s appointment as the next Reserve Bank of India (RBI) governor dashed speculation that monetary policy will be eased aggressively.

Bonds had rallied since June after RBI governor Raghuram Rajan’s announcement that he will step down when his term ends in early September sparked speculation his successor will be more willing to lower policy rates. Patel’s elevation from deputy governor disappointed some investors because he had burnished his inflation-fighting credentials by advocating consumer-price targeting and the formation of an independent monetary policy panel.

“There is a bit of disappointment in the bond market after the government named Patel to head the central bank,” said Bhupesh Bameta, head of research for currencies and rates at Edelweiss Financial Services Ltd in Mumbai.

The yield on the 10-year debt rose three basis points this week, the biggest increase since 26 February, to 7.13% in Mumbai, according to data from the central bank’s trading system. It jumped six basis points on Monday after the government named Patel as Rajan’s successor over the weekend. It rose one basis point Friday.

Bonds had rallied after Rajan’s 18 June announcement that he will return to academia, pushing the benchmark 10-year yield to 7.08% on 11 August, the lowest since September 2009.

>>> Nifty Weekly Chart <<<

>>> Click the chart to see on full screen <<<

Clear sign of bear visible on Weekly Chart. RSI broken down and Price unable to cross above 8720 for last 3 week. Caution advised.

>>> Nifty Daily Chart <<<

>>> Click the chart to see on full screen <<<

Price must follow the RSI to break the trend or support line.

>>> Nifty Hourly Chart <<<

>>> Click the chart to see on full screen <<<

Price inside a small range for last two and half month - must either breaks above or break below the channel to confirm the trend.

>>> Bank Nifty Daily Chart <<<

>>> Click the chart to see on full screen <<<

Daily BN shows - 19150 is a good support.

>>> Bank Nifty - Hourly Chart <<<

>>> Click the chart to see on full screen <<<

19130 and 19030 - Should hold for an UPmove. If breaks then Fall to start.

>>> AsianPaints - Posted on 18th Aug, 2016 <<<

>>> Click the chart to see on full screen <<<

Above chart posted as a follow up on 18th Aug, 2016 - as a possible chances of correction and advised to hold short. See what happened.

>>> Asian Paints - Profit Booked Rs.20,400 <<<

>>> Click the chart to see on full screen <<<

We have booked Profit near 1104 with Rs.20,400/- As per above chart, If price break again the trend line, Fall can again resume.

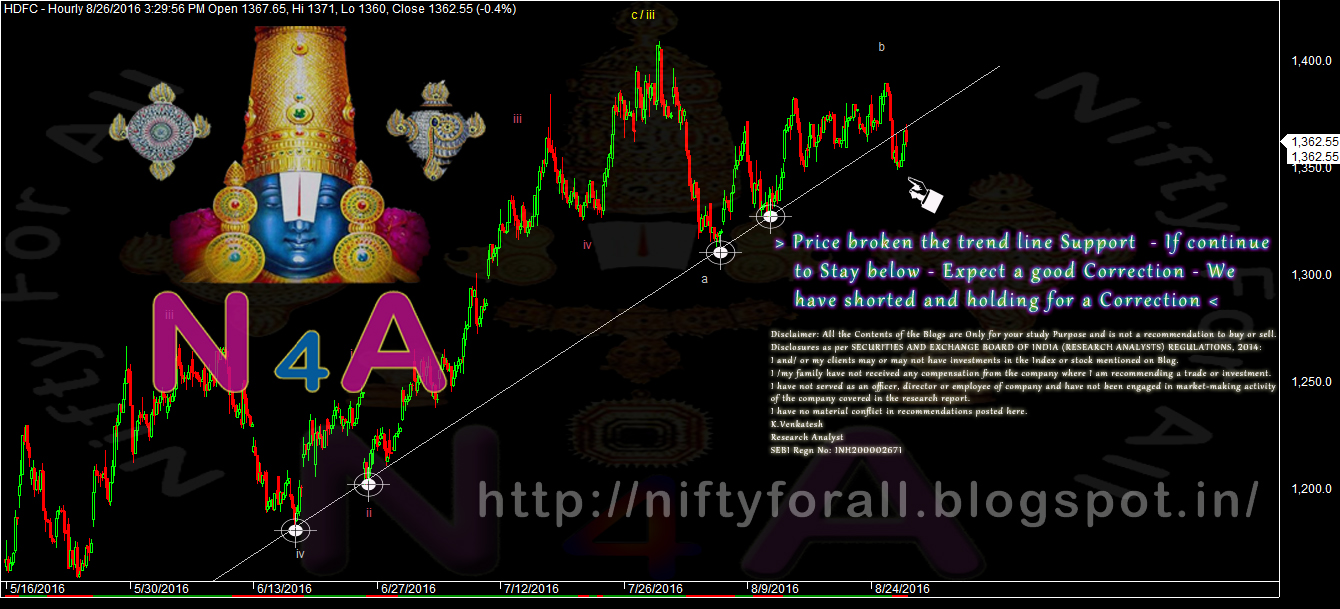
>>> HDFC - Hourly Chart <<<

>>> Click the chart to see on full screen <<<

We have shorted - expecting a good correction.

>>> Performance till 26th August, 2016 <<<

>>> Click the image to see on full screen <<<

Above performance is not a Promise or guarantee for the given Profits or Loss. Performance given based on 1 lot at a time and clients Profit differ as per the margin availability and Number of Lots taken by them. We may or may not re-enter the Calls given here hit Stop Loss, as per market movement. The charts given above are just for educational purpose only and we don't recommend any Entry / Buy or Exit / Sell. Reader must taken their own decision or consult their qualified Analyst before making any decision

Thursday, August 25, 2016

Support @ 8580-85

Dear All,

>>> Nifty Daily Chart <<<

>>> Click the chart to see on full screen <<<

8580-80 if breaks - Price may test the trend line. If breaks the trend line - More fall likely. Lets Wait and See. Cheers!!!

Wednesday, August 24, 2016

Will Expiry End this Volatile

Dear All,

>>> Nifty Hourly Chart <<<

>>> Click the chart to see on full screen <<<

Its almost moving inside a small range with lot of volatile and high choppiness. Lets hope this expiry will end this and break either levels to confirm the trend.

Monday, August 22, 2016

8650 & 8685 - Resistance

Dear All,

>>> Nifty Hourly Chart - Posted on Weekly Review <<<

>>> Click the chart to see on full screen <<<<

Wrote on Weekly Review - about the importance of the trend line on hourly chart.

>>> Nifty hourly Chart - Happened <<<

>>> Click the chart to see on full screen <<<<

Price broken a 3 month old support or trend line, Price if breaks next support levels like 8580,8540 & 8520 - Bear may take full control.

>>> Bank Nifty Hourly Chart <<<

>>> Click the chart to see on full screen <<<<

Price should get support @ 19250,19130 & 19030 for next level of rally. Resistance @ 19440 & 19490. Cheers!!!

Sunday, August 21, 2016

Weekly Review - 22nd August, 2016

Dear All,

August F&O expiry: Investors are advised to tread with caution as the market is likely to turn volatile in the coming week amid the expiry of August series derivative contracts, as traders roll over positions to the September series.

Urjit Patel new RBI Governor: The government late Saturday announced the appointment of Urjit Patel, the current Deputy Governor of RBI, to take over the reins of RBI from Raghuram Rajan, when the later ends his term on September 4.

Fed Meeting :- All eyes will be on Janet Yellen speech in the upcoming Jackson Hole symposium on Friday. The minutes from the July 26-27 policy meeting showed that rate-setters were split over the necessity of tightening policy soon.

A recent batch of strong US employment data fuelled expectations that the central bank could raise policy rates in September, however, a clarity is something which is still missing amid mixed views from policy makers. Yellen, though, is likely to reassure market participants across the globe of a slower pace of rate increase.

>>> Nifty Weekly Chart <<<

>>> Click the chart to see on full screen <<<

A Doji followed by a hanging man, can be a reversal of bearish trend created by hanging man previous week. Volatile and Choppiness to continue, until a clear confirmation on either side.

>>> Nifty Daily Chart <<<

>>> Click the chart to see on full screen <<<

8720 and 8685 play an important resistance on Daily chart.

>>> Nifty Hourly Chart <<<

>>> Click the chart to see on full screen <<<

Hourly chart - shows Bears giving a danger signal. Break below the trend line may trigger a big or good sell off any time. 8720 and 8685 may resist Bulls.

>>> Bank Nifty Daily Chart <<<

>>> Click the chart to see on full screen <<<

After breaking 19150 price made a DOJI on the top of the chart, hope there can be a bit consolidation too.

>>> Bank Nifty Hourly Chart <<<

>>> Click the chart to see on full screen <<<

19480-90 may resist bank nifty.


Thursday, August 18, 2016

8685 > Above Upmove

Dear All,

>>> Nifty Hourly Chart <<<

>>> Click the chart to see on full screen <<<

Price if crosses 8685 - may possibly test 8720 and 8750 soon.

>>> Bank Nifty - Posted on 16th Aug, 2016 <<<

>>> Click the chart to see on full screen <<<

Have mentioned 19150 as an important resistance. See what happened today.

>>> Bank Nifty Hourly Chart - Happened <<<

>>> Click the chart to see on full screen <<<

We have exited our short above 19150 and price test 19367-70 Level.

>>> Asian Paints - As Posted on 10th Aug, 2016 <<<

>>> Click the chart to see on full screen <<<

Have wrote on 10th Aug, 2016, Asian Paint may correct. See what happened.

>>> Asian Paints - Happened - More Correction Possible <<<

>>> Click the chart to see on full screen <<<

RSI and MA's - almost confirmed the Correction. Lets Wait and See. Cheers!!!

Wednesday, August 17, 2016

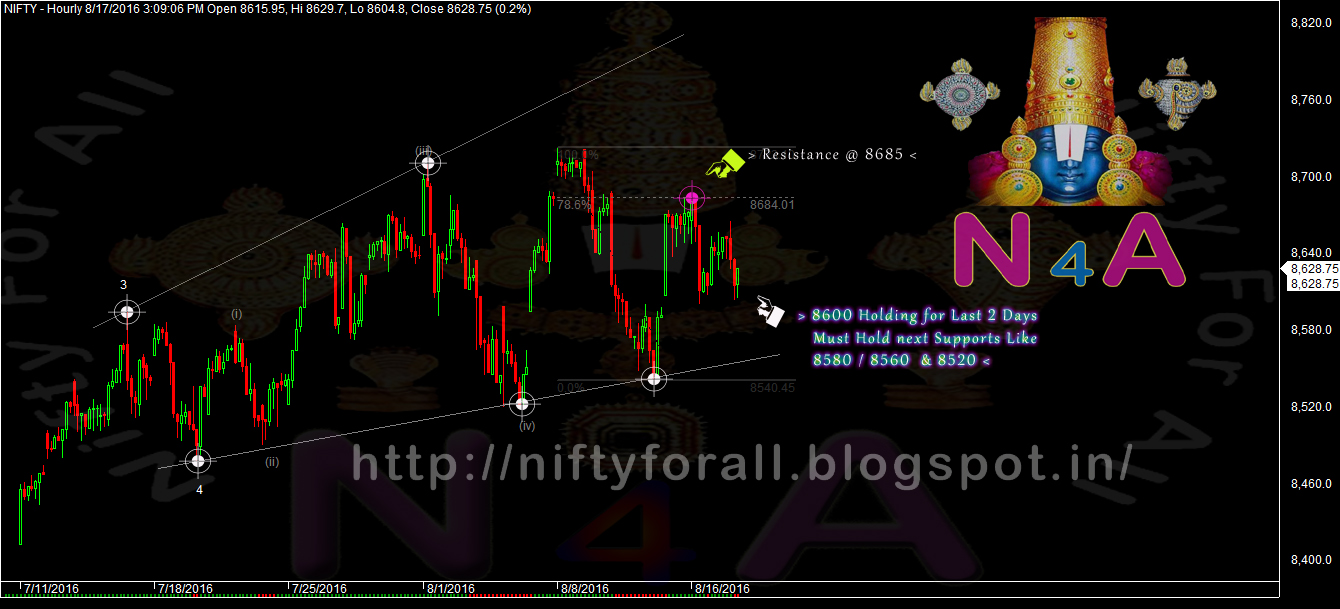
Support @ 8600 - 8580 - 8560 & 8520

Dear All,

>>> Nifty Hourly Chart <<<

>>> Click the chart to see on full screen <<<

8600 Holding for last two days. Lets wait and watch for next support 8580 / 8560 & 8520. Else 8685 or 8720 should cross for Strength.