Pages

Thursday, December 22, 2016

Next Support @ 7950-60 & 7920

Dear All,

>>> Nifty Hourly Chart <<<

>>> Click the chart to see on full screen <<<

Price corrected its maximum of 161.8% for Wave C to. Hence 7950-60 must hold.

>>> Axis Bank - Hourly Chart <<<

>>> Click the chart to see on full screen <<<

Entered long near the base line and expecting a pull back soon. Cheers!!!

Wednesday, December 21, 2016

Lets Wait and Watch 8030

Dear All,

>>> Nifty Hourly Chart <<<

>>> Click the chart to see on full screen <<<

Its a painful December so far - Either Side Traders have lost their money - Lot of confusions and Daily Changing Policies of RBI - Panic Statement of some Economist on TV Channel - almost made the Entire trading community to slip till the edge of Chaos. So far no light at this tunnel.

Its a Duty of an Analyst to clarify atleast to some extend by his chart to show how and where the market is hedging. So tried a bit to clarify to our reader - as per above given Chart. So tomorrow - If 8030 holds at the end of the day - Lets expect a pull back soon. Cheers!!!

Tuesday, December 20, 2016

Below 8080 may test 8030

Dear All,

>>> Nifty Hourly Chart <<<

>>> Click the chart to see on full screen <<<

Must hold 8080, else next support may be 8030. Price need to break above the wedge for a healthy rally.

Monday, December 19, 2016

Support @ 8080 & 8030

Dear All,

>>> Nifty Hourly Chart <<<

>>> Click the chart to see on full screen <<<

Every candle bar shows the choppiness and Pain which pull down Volatility index below 15 in favour of Option Writers. Current fall assumed as wave B - Looks like an Falling Wedge may get support @ 8080 or 8030.

Saturday, December 17, 2016

Weekly Review - 19th December, 2016

Dear All,


In a unanimous decision, the Federal Open Market Committee (FOMC) raised the target federal funds rate by 25 basis points to between 0.50% and 0.75% and signalled a faster pace of increases in 2017 and 2018, heightening fears that higher interest rates in US would trigger foreign investment outflows from emerging markets including India towards the US.

The wholesale price index (WPI)-based inflation fell to a five-month low of 3.15% in November from 3.39% in the previous month, while the Consumer Price Index (CPI)-based inflation fell to 3.63% in November — a record low in the new series — from 4.2% in October as the rate of rise in food prices were dampened by the cash crunch following the demonetisation of high-value currency notes from November 8 onwards.

The next week will start with yearly deposit growth data along with foreign reserves data, followed by bank loan growth. Globally, the data like US existing home sales and crude oil inventories will remain in focus.

Meanwhile, foreign investors sold over Rs 1280 crore worth of equities in four days to Thursday, data available with National Securities Depository suggested. On Friday, they sold equities worth Rs 90 crore, provisional data available with the BSE showed.


>>> Nifty Weekly Chart <<<

>>> Click the chart to see on full screen <<<

Since we have posted a Bullish candle stick formation for last 2 weeks - We need to analyse last formation also. Its an inside candle - Usually an inside Red candle shall be considered negative of the upper side of the chart - Since its formed on the lower side - a chance of 50:50 can be taken. Candle formed between 100 & 50 WMA should be watched. Break above or below may be an trigger for either side.

>>> Nifty Daily Chart <<<

>>> Click the chart to see on full screen <<<

Its a painful consolidation week and many traders lost their patience also. Received many suggestion and Target from many traders, even criticism for my bullish view. Even a Negative stance taken by RBI and FED did not trigger a major sell off both times. Means the markets in the hands of Option Writers. A complicated wave move with lot of extensions and changing sub waves keeps changing their respective supports. So far my chart did not suggest a major sell off immediately. Above Pole and flag formation also showing an upmove.

>>> Nifty Hourly Chart <<<

>>> Click the chart to see on full screen <<<

Its an Irregular ABC - Hence the probability of B can be till 8080 or 8030 on the downside. Complexity of Wave B movement - give more choppy and pain. So lets wait for Wave B to get complete.

>>> Bank Nifty Daily Chart <<<

>>> Click the chart to see on full screen <<<

Lot of Bad News - Expectations - Restless Comments - Ruthless Targets - Bank Nifty Chart - Must be a Most Debated and Argued Chart in recent time I hope. Demonetisation = RBI Disappointment - FED Rate Hike - IT & ED Raids on All Pvt and PSU Banks - All News are factored in the above Chart.
So I feel the above chart - may trigger a rally till 18960 & 19270 till it take the recent low. Hope the W-X-Y count is almost completed and RSI also showing a lot of Positive divergence - If breaks above the trend line - Bulls may gain strength.

>>> CNX - IT - 400 Point Profit and Still Moving UP <<<

>>> Click the chart to see on full screen <<<

More rally above 10300.

>>> Oriental Bank Of Commerce - Hourly Chart <<<

>>> Click the chart to see on full screen <<<

We are Holding Long in OBC and if the Support holds as shown on above chart - Expect a rally soon.

>>> ACC - Possible Rally Soon <<<

>>> Click the chart to see on full screen <<<

Support Line - Must hold for a Good Rally till the top of the channel - We are long and expecting a Rally. Cheers!!!

>>> Performance till 16th Dec, 2016 <<<

>>> Click the chart to see on full screen <<<

Above performance is not a Promise or guarantee for the given Profits or Loss.Performance given based on 1 lot at a time and clients Profit differ as per the margin availability and Number of Lots taken by them. We may or may not re-enter the Calls given here hit Stop Loss, as per market movement. The charts given above are just for educational purpose only and we don't recommend any Entry / Buy or Exit / Sell. Reader must taken their own decision or consult their qualified Analyst before making any decision

>>> N4A - Services <<<


Send your Service related queries to niftyforall@yahoo.com and whatsapp @ 9677924975

Thursday, December 15, 2016

Support @ 8080 & 8030

Dear All,


The dollar surged against its peers Thursday and most Asian markets tumbled after the Federal Reserve indicated it will likely embark on a steeper path of interest rate hikes over the next year.While the decision to lift rates had been a certainty, a plan to hike them three times rather than the expected twice jolted trading floors. The news sent the dollar soaring well past 117 yen and its highest level since February, while it also bulldozed other currencies, particularly higher-yielding, riskier, units and those of emerging market nations.

In her post-announcement conference, Yellen said the rise was a reflection of “the confidence we have in the progress that the economy has made and our judgment that progress will continue”.

The US bond yield and the dollar strengthened post the announcement, which is negative for emerging markets, including India, as the risk of outflows goes up. Our indices contained the losses on the back of buying in IT stocks supported by a strong dollar against the rupee. Sentiment took a hit as fears grew that a rate hike in the US would mean higher pace of capital outflows from emerging markets, including India, into US bonds that are considered as a safer investment option.

The Fed's anticipated policy path, and expectations US President-elect Donald Trump will set growth on a higher gear, are keeping Asian policymakers on edge as capital gets sucked out from the fragile export-dependent regional economies toward dollar-based assets

>>> Nifty Hourly Chart <<<

>>> Click the chart to see on full screen <<<

Its a complicated move - hence volatile is by its nature. Support like 8110 - 8080 and 8030 must hold for Wave C rally.

>>> Bank Nifty Hourly Chart <<<

>>> Click the chart to see on full screen <<<

Price consolidating inside the expanding triangle for many days - though big events like RBI & FEB Can't break above or below the Triangle shows the strength of the Option Writers. So its quite natural - a PUT or Call Buyer might have incurred a Loss so far.

>>> CNX-IT Posted on 13th Dec, 2016 <<<

>>> Click the chart to see on full screen <<<

Posted on 13th Dec, 2016 - IT Index on a Break Out. We are Long & See what happened.

>>> CNX - IT - More Rally above 10,300 <<<

>>> Click the chart to see on full screen <<<

Above 10300 - More Rally ahead as shown on chart. Cheers!!!

>>> N4A - Services <<<


Send Your Service enquiries to niftyforall@yahoo.com or whatsapp @ 9677924975.

Wednesday, December 14, 2016

Support @ 8150 & 8130

Dear All,

>>> Nifty Hourly Chart <<<

>>> Click the chart to see on full screen <<<

Price need to hold the support @ 8180, 8160 & 8130.

>>> Axis Bank - Posted Yesterday <<<

>>> Click the chart to see on full screen <<<

Wrote Yesterday - Price on a Break out - for the second time. See what Happened.

>>> Axis Bank - Booked Profit Rs.22800/- <<<

>>> Click the chart to see on full screen <<<

Booked with Rs.22800/- Profit. Cheers!!!

Tuesday, December 13, 2016

Key Support @ 8150. Resistance @ 8230 & 8250

Dear All,

>>> Nifty Hourly Chart <<<

>>> Click the chart to see on full screen <<<

As wrote Yesterday - Price took support @ 8150 and started moving near 8230. Above 8230 may test 8250 as shown on chart.

>>> Bank Nifty Hourly Chart <<<

>>> Click the chart to see on full screen <<<

If holds above 18460 - may test 18650 soon.

>>> CNX-IT - Break Out <<<

>>> Click the chart to see on full screen <<<

Clear break out visible - if holds above the channel - more rally on card as mentioned on chart.


>>> AXISBANK - Break Out - We are Long Again <<<

>>> Click the chart to see on full screen <<<

Break out for the Second time after many bad news and consolidation - We are long and holding for a good Profit. Cheers!!!

Monday, December 12, 2016

Support @ 8150

Dear All,

>>> Nifty 5 Mins Chart <<<

>>> Click the chart to see on full screen <<<

Support @ 8150.

Saturday, December 10, 2016

Weekly Review - 12th Dec, 2016

Dear All,


It has been a choppy ride for the Indian equity markets that had been hit by the double whammy of demonetisation and the surprise victory of Donald Trump in the US Presidential elections, exactly a month ago on November 8. India’s Nifty (down 3.5%) was the second worst performing index in Asia after Philippines, and the fourth globally – after Mexico (down 5.9%), Brazil (4.3%) and Philippines (down 3.9%).

Markets will now depend on US Fed rate action, Union Budget 2017, growth in corporate earnings, progress made as regards the goods and services tax (GST) bill. Though the market has priced in a 25 basis point rate hike by the US Federal Reserve in December 2016, it is not prepared for an aggressive guidance for CY 2017.

>>> Nifty Weekly Chart - Posted Last Week <<<

>>> click the chart to see on full screen <<<

Wrote last week - Price made a double confirmation on candle sticks side. Lets see what happened this week.

>>> Nifty Weekly Chart - Happened <<<

>>> click the chart to see on full screen <<<

Price made a strong close than previous candle high and confirmed the Bulls Strength. Close above 50 & 100 WMA also give more strength.

>>> Nifty Daily Chart <<<

>>> click the chart to see on full screen <<<

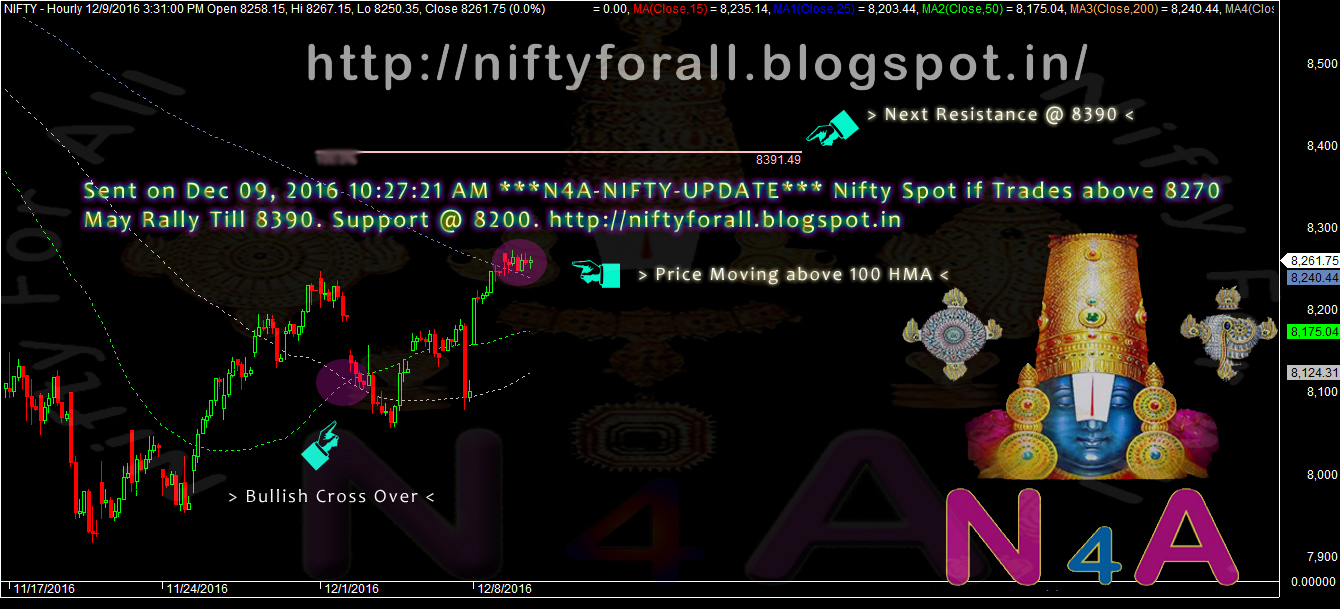
Price constantly moving above 200 DMA - may test 8340,8390 and 8420 next week.

>>> Nifty Hourly Chart <<<

>>> click the chart to see on full screen <<<

Price moving above 200 HMA, may possibly test 8390 or above.

>>> Bank Nifty Weekly - Posted Last Weekly Review <<<

>>> click the chart to see on full screen <<<

Price made a Bullish hammer last week - See what happened.

>>> Bank Nifty Weekly Chart - Happened <<<

>>> click the chart to see on full screen <<<

Price almost test 61.8% for Wave (x) or (4) as shown above. A Bullish candle shows more rally possible.

>>> BankNifty Daily = Posted Last Weekly Review <<<

>>> click the chart to see on full screen <<<

Bank Nifty almost inside the channel - Wrote last week - Price may take support @ the channel or may test 17750 on worst case. See what happened.

>>> Bank Nifty Daily Happened <<<

>>> click the chart to see on full screen <<<

Price started moving above the channel shows some strength, may continue its rally next week also.

>>> Bank Nifty Hourly <<<

>>> click the chart to see on full screen <<<

Bank Nifty Hourly - If able to cross above 18750 - More Fire Works Possible.

>>> CNX-IT Posted on 08th Dec, 2016 <<<

>>> click the chart to see on full screen <<<

Wrote on 08th Dec, We have entered long and expecting price to move up. See what happened.

>>> CNX-IT - Booked Profit Rs.10,000/- <<<

>>> click the chart to see on full screen <<<

Booked Rs.10,000/- Profit - Price gave a break out as shown on above chart - More rally possible.

>>> SBIN - Hourly Chart - Posted on 30th Nov, 2016 <<<

>>> click the chart to see on full screen <<<

Posted on 30th Nov, about possible rally on SBI. See what happened.

>>> SBIN - Booked Profit Rs.30,000/- <<<

>>> click the chart to see on full screen <<<

Profit booked @ 265 with Rs.30,000/- Profit.

>>> Performance till 09th Dec, 2016 <<<


Above performance is not a Promise or guarantee for the given Profits or Loss.Performance given based on 1 lot at a time and clients Profit differ as per the margin availability and Number of Lots taken by them. We may or may not re-enter the Calls given here hit Stop Loss, as per market movement. The charts given above are just for educational purpose only and we don't recommend any Entry / Buy or Exit / Sell. Reader must taken their own decision or consult their qualified Analyst before making any decision


Send your Service queries to niftyforall@yahoo.com or whatsapp @ 9677924975

Thursday, December 08, 2016

Above 8250 - 8260 - More Rally & Short Covering.

Dear All,


>>> Nifty Hourly Chart <<<

>>> Click the chart to see on full screen <<<

Price resisted @ 8250. More Rally & Short Covering possible - if crosses above 8250-60. We are Holding our Long.

>>> Bank Nifty Hourly Chart <<<

>>> Click the chart to see on full screen <<<

Bank Nifty - may decide the entire market movement in coming days. Price need to break above 18700+ for a healthy rally, still more banks are showing weakness and yet to give strength.

>>> NIFTY - IT - Hourly Chart <<<

>>> Click the chart to see on full screen <<<

We are long in Nifty IT also. Above 9950 More rally coming. Lets See. Cheers!!!

Wednesday, December 07, 2016

Must Hold 8080, Else May Test 8000 Again

Dear All,

>>> Nifty Hourly Chart <<<

>>> Click the chart to see on full screen <<<

Of course again it looks like a Head & Shoulder. So in case if breaks trend line along with 8080, price may test 8000 or previous low 7930 also. If holds, may re bounce and cross above recent high 8250. News Flow and economic events may dictate the trend. Cheers!!!