Pages

Monday, February 06, 2017

Next Resistance @ 8885 - 8890

Dear All,

>>> Nifty Hourly Chart - Posted on Weekly Review <<

>>> Click the chart to see on full screen <<<

Wrote on Friday - if price able to cross above 8750 Next level to watch can be till 8890.

>>> Nifty Hourly Chart - Happened <<<

>>> Click the chart to see on full screen <<<

Price need to hold above 8750 for a rally till 8885-8890.

>>> MINDTREE - Upates <<<

>>> Click the chart to see on full screen <<<

MindTree - ON the Verge of Break out - Above 468 - Expect a Fresh Rally. We are Holding our Long since 450 for More Profitable Rally.

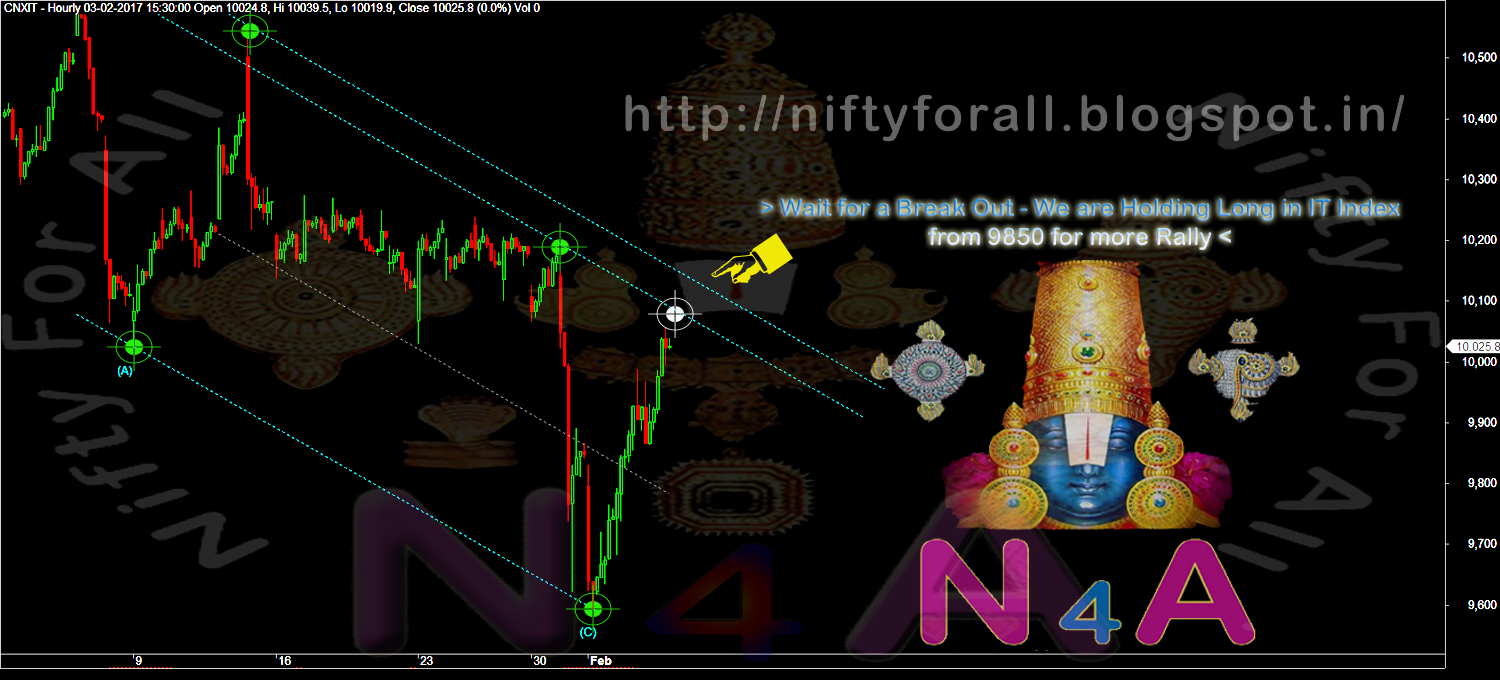
>>> CNX - IT - Hold Long <<<

>>> Click the chart to see on full screen <<<

We are still long from 9850 - looking for more rally - Cheers!!!

Saturday, February 04, 2017

Weekly Review - 06th Feb, 2017

Dear All,


A smart rally on the Budget day pushed the market to end the week higher with Nifty reclaiming its crucial 8,700 mark, however, the cautious sentiment ahead of the Reserve Bank of India’s policy meeting and visa woes on the IT sector kept the momentum slow.

Budget 2017

‘No bad news is good news’ is what sums up best Budget 2017 for stock market. The Finance Minister Arun Jaitley refraining from tweaking long-term capital gains (LTCG) soothed investors’ nerves, while sector specific budgetary stimulus such as according infrastructure status to affordable housing, relief on LTCG on immovable property, plans to create a mega oil firm along with setting up a comfortable fiscal deficit target of 3.2% for FY18 boosted market spirit.

Global cues

An eventful week back home overshadowed the significant global developments that played quietly in the stock market. The US Federal Reserve kept interest rates unchanged, while Bank of Japan also maintained status quo in their respective policy meetings. Bank of England also said they are in no rush for rate hikes. They repeated that they could tolerate some overshoot of their inflation target, but only within limits. Meanwhile, People's Bank of China unexpectedly raised the interest rates on open market operations, adding to growing concerns about US President Donald Trump's aggressive policies.

MARKET NEXT WEEK:

The investors will took cues from the strong US jobs growth data which pushed the Wall Street higher on Friday. Index of Industrial Production (IIP) data due on Tuesday and Reserve Bank of India’s policy meeting scheduled for Wednesday will also be under investors’ radar.

>>> Nifty Daily Chart <<<

>>> Click the chart to see on full screen <<<

Two Resistance as given on Chart - Might be end of Bulls wave. 8770 or 8990 might stop the bulls from moving further.

>>> Nifty Hourly Chart <<<

>>> Click the chart to see on full screen <<<

Above 8750 - Price may test 8885-8890 any time.

>>> Nifty Bank - Daily Chart <<<

>>> Click the chart to see on full screen <<<

Price made a Break out for Wave X.

>>> Nifty Bank - Hourly Chart <<<

>>> Click the chart to see on full screen <<<

20500 - looks possible as per above chart, If not wrong.

>>> CNX-IT - Posted on 02th Feb, 2017 <<<

>>> Click the chart to see on full screen <<<

Wrote on 02nd Feb, 2017 for a Possible reversal.

>>> CNX-IT - Holding Long - More Rally Possible <<<

>>> Click the chart to see on full screen <<<

Holding Long - If breaks out - Expect more Rally.

>>> BIOCON - Posted Last Weekly Review <<<

>>> Click the chart to see on full screen <<<

Earlier - On last Weekly Review - Mentioned Biocon - might have topped out. We have entered Short also - See what happened.

>>> BIOCON - Profit Booked @ 998 & Exited <<<

>>> Click the chart to see on full screen <<<

We Booked our Profit on Biocon Short - as the Last leg getting extended. Based on chart - we may or may not - re-enter short again as per Price movement.

>>> AdaniPort - Booked Profit on 31st Jan, 2017 <<<

>>> Click the chart to see on full screen <<<

Earlier on 31st Jan, We Booked Profit Rs.25000/- and Exited.

>>> AdaniPort - Re-Entered Short for a Good Correction <<<

>>> Click the chart to see on full screen <<<

Re-Entered Short - A Raising Wedge Like Pattern - Possibly may break - for a Wave C Fall any time.

>>> Divis Lab - Posted on 02nd Feb, 2017 <<<

>>> Click the chart to see on full screen <<<

Wrote - Price may give more rally.

>>> Divis Lab - Booked Profit Rs.30,000/- Near 750 <<<

>>> Click the chart to see on full screen <<<

More rally Possible - As Stocks looks like - Bottomed out. We have advised less risky traders to take profit Rs.30,000/- near 750.

>>> MindTree - Carry Long - Posted on 01st Feb, 2017 <<<

>>> Click the chart to see on full screen <<<

We are holding long for more rally from 450.

>>> N4A - Services <<<


Send your Service queries to niftyforall@yahoo.com or whatsapp @ 9677924975

>>> Performance for the month end of Jan, 2017 <<<

>>> Click the image to see on full screen <<<

Above performance is not a Pomise or guarantee for the given Profits or Loss.Performance given based on 1 lot at a time and clients Profit differ as per the margin availability and Number of Lots taken by them. We may or may not re-enter the Calls given here hit Stop Loss, as per market movement. The charts given above are just for educational purpose only and we don't recommend any Entry / Buy or Exit / Sell. Reader must taken their own decision or consult their qualified Analyst before making any decision

Thursday, February 02, 2017

Resisted @ 8750 & Closed below 8730

Dear All,


>>> Nifty Hourly Chart <<<

>>> Click the chart to see on full screen <<<

Wrote Yesterday 8730 & 8750 a Key Resistance. Price need to cross above 8750 for a good upmove. Lets wait and See.

>>> CNX-IT - Hourly Chart - We are Long <<<

>>> Click the chart to see on full screen <<<

We are Long in IT Index and waiting for a Good Rally + Short Covering.

>>> DivisLab - Daily Chart - We are Long <<<

>>> Click the chart to see on full screen <<<

We are Long in DivisLab since 700, Hope the stock is bottomed out. If Manage to trade above the channel as shown on above Chart - Expect Worst is Over. Good Rally and Short Covering may give us a Great Profit. Cheers!!!

Wednesday, February 01, 2017

Resistance 8730

Dear All,

>>> Nifty Hourly Chart <<<

>>> Click the chart to see on full screen <<<

If i'm not wrong - above chart suggest me an irregular wave as 'abc', hence price may see a possible correction of another 200 points.

>>> MINDTREE - Daily Chart <<<

>>> Click the chart to see on full screen <<<

We are Long - Expecting Wave C on the Upside. Cheers!!!

Tuesday, January 31, 2017

Below 8550 - May Test Next Resistance @ 8510

Dear All,

>>> Nifty Hourly Chart <<<

>>> Click the chart to see on full screen <<<

Price if breaks below 8550 - Expect next support @ 8510-12.

>>> AdaniPort = Hourly Chart - Posted on 27th Jan, 2017 <<<

>>> Click the chart to see on full screen <<<

Posted on 27th Jan,2017 - Price completed "ABC" and may correct any time.

>>> AdaniPort - Profit Booked Today Rs.25000/- <<<

>>> Click the chart to see on full screen <<<

Today we Have booked with Rs.25000/- Profit. We may or may not re-enter as per movement.

Sunday, January 29, 2017

Weekly Review - 30th January - 2017

Dear All,


Foreign investors turned net buyers for the week, purchasing equities worth nearly Rs 1,300 crore. Till Wednesday, FIIs bought equities worth Rs 1,082 crore, data available with National Securities Depository Ltd (NSDL) showed. On Friday, they were net buyers to the tune of Rs 212 crore, provisional data available with BSE showed.

MARKET NEXT WEEK: Finally, we enter the Budget week with the much-awaited B-day falling on Wednesday. Government’s move on Friday on general anti-avoidance rules (GAAR, on taxes) has set the positive tone for more Budget stimulus, yet the investors are expected to trade sideaways in the two-day to Budget, while the Budget announcements will of course chart the market direction during the rest of the days. Besides, several central banks are scheduled to take a call on interest rates next week.

>>> Nifty Weekly Chart <<<

>>> Click the chart to see on full screeh <<<

Nifty Weekly chart - forming a IHS like Pattern, Price need more confirmation to confirm it.

>>> Nifty Daily Chart <<<

>>> Click the chart to see on full screeh <<<

Break above 8460 confirmed the rally till 8740 or 8760.

>>> Nifty 5 Mins Chart <<<

>>> Click the chart to see on full screeh <<<

Above 5 mins chart - suggest a possible end of wave 3 and price may consolidate for 4th wave. 8597 and 8550 may give support.

>>> Nifty Bank Weekly Chart <<<

>>> Click the chart to see on full screeh <<<

Bank Nifty may test the Trend line and MA's also on the Buy side.

>>> Nifty Bank Hourly Chart <<<

>>> Click the chart to see on full screeh <<<

Nifty Bank Resisted @ channel top and may find its support @ 19545 and 19390.

>>> BIOCON - Daily Chart <<<

>>> Click the chart to see on full screeh <<<

Hope Biocon has topped out as per above chart, Possibly may test the below channel support any time.

>>> AdaniPort - Hourly Chart <<<

>>> Click the chart to see on full screeh <<<

AdaniPort - Price Topped as "ABC" - If unable to cross above - may trigger correction - Cheers!!!

>>> Peformance till 27th Jan, 2017 <<<

>>> Click the image to see on full screeh <<<

Above performance is not a Pomise or guarantee for the given Profits or Loss.Performance given based on 1 lot at a time and clients Profit differ as per the margin availability and Number of Lots taken by them. We may or may not re-enter the Calls given here hit Stop Loss, as per market movement. The charts given above are just for educational purpose only and we don't recommend any Entry / Buy or Exit / Sell. Reader must taken their own decision or consult their qualified Analyst before making any decision

Thursday, January 26, 2017

Key Resistance 8650

Dear All,

>>> Nifty Daily Chart <<<

>>> Click the chart to see on full screen <<<

Above 8650 another 200 point rally not ruled out.

Tuesday, January 24, 2017

Key Resistance @ 8480 & 8515

Dear All,

>>> Nifty 5 Mins Chart <<<

>>> Click the chart to see on fulls screen <<<

Price so Today has completed or almost completed an Irregular Correction. Key Resistance 8480 or 8515 if not crossed - We may see some meaningful correction. Caution advised. above 8515 this analysis and count negated. Cheers!!!

Monday, January 23, 2017

Next Resistance @ 8400, 8430& 8450

Dear All,

>>> Nifty Hourly Chart <<<


>>> Click the chart to see on full screen <<<

Price may test 8430 and 8450 if manage to cross and hold above 8400. Cheers!!!

Saturday, January 21, 2017

Weekly Review - 23rd Jan 2017

Dear All,


The market settled lower for the first time in four weeks with the tax relief for foreign portfolio investors (FPIs) and the resolution of dual control issue on Goods and Services Tax (GST) failing to outweigh the negative earnings from financials, International Monetary Fund (IMF)’s 100 basis points cut in growth forecast and global concerns ahead of US president-elect Donald Trump’s swearing-in ceremony. Trump took presidency oath post market hours on Friday

"Till Thursday, Q3 results were coming marginally above expectations and the market was holding a positive view. However, a poor set of numbers led by financials has annoyed the investors turning them cautious. Additionally, commodity stocks are losing their attractiveness due to consolidation ahead the Trump swearing-in ceremony today. IT and Pharma stocks will be keenly watched as the segment may be effected from the upcoming US policies."

Amid ongoing earnings season with Budget 2017 approaching, the market is expected to witness heightened volatility in a holiday-truncated expiry week. Investors will react to Trump’s inauguration speech on Monday, wherein he hinted again at his protectionist stance by reiterating US policy will be to buy American and hire American, while earnings results of heavyweights like, HUL, HDFC, Bharti airtel and Ultratech will also be in focus.

GAAR - New Fear :-

Key benefits given to Foreign Portfolio Investors (FPIs) under amended tax treaties with Singapore, Cyprus and Mauritius may be negated by the implementation of General Anti-Avoidance Rules (Gaar).

Domestic anti-avoidance law will prevail over treaty benefits in the event of a dispute under the Singapore and Mauritius treaties. This could threaten the lower tax rate for FPIs in the two years between April 1, 2017, and March 31, 2019. Under the amended treaties, short term capital gains tax for FPIs is 15%. However, during the transition window cited above, this will be 7.5%, subsequently doubling to 15%. The tax treaties with these countries were amended last year.

Many FPIs are also worried that benefits under the amended treaties for derivatives and debt instruments may be questioned under Gaar. Tax officials confirmed that Gaar will take effect on April 1 and that the government is not looking at issuing any additional regulations before March 31 at a meeting held recently with industry representatives, said people aware of the development.

>>> Nifty Weekly Chart <<<

>>> Click the chart to see on full screen <<<

Weekly Chart suggest a Bull & Bear Struggle ahead in coming weeks. Every one must trade cautiously on Nifty to Protect their capital - as I hope these volatile may continue for many more days.

>>> Nifty Daily Chart <<<

>>> Click the chart to see on full screen <<<

For the second week in a row - Price failed to cross above 8460 and 100 DMA - which triggered sell off, with Trump Fear.

>>> Nifty Hourly Chart <<<

>>> Click the chart to see on full screen <<<

Price broken the expanding triangle - took support @ 8340. Price may try to fill the gap below 8340 Next Week.

>>> Nifty Bank - Weekly Chart <<<

>>> Click the chart to see on full screen <<<

Again in Bank Nifty - Weekly Chart had a mixed signal - Bearish Candle and Bullish MA. So get ready for more volatile in coming weeks.

>>> Nifty Bank - Daily Chart <<<

>>> Click the chart to see on full screen <<<

Price failed to hold 100 DMA after testing 61.8% retrace, may try to test 50DMA and fill the gap left below as shown on chart.

>>> Bank Nifty Hourly Chart <<<

>>> Click the chart to see on full screen <<<

Price if breaks the last channel support - Expect another 400 Points correction to fill the gap left below.

>>> AdaniPort - Posted on 18th Jan, 2017 <<<

>>> Click the chart to see on full screen <<<

Wrote on 18th Jan, 2017 - Adani Port may correct as ABC wave completed. See what happened ?

>>> AdaniPort - Profit Booked on Friday Rs.25000/- <<<

>>> Click the chart to see on full screen <<<

We have booked our short with Rs.25000/- Profit.

>>> Voltas - Shorted & Booked Rs.20,000/- Profit <<<

>>> Click the chart to see on full screen <<<

Booked Rs.20,000/- Profit.

>>> Performance till 20th Jan, 2017 <<<

>>> Click the image to see on full screen <<<

Above performance is not a Pomise or guarantee for the given Profits or Loss.Performance given based on 1 lot at a time and clients Profit differ as per the margin availability and Number of Lots taken by them. We may or may not re-enter the Calls given here hit Stop Loss, as per market movement. The charts given above are just for educational purpose only and we don't recommend any Entry / Buy or Exit / Sell. Reader must taken their own decision or consult their qualified Analyst before making any decision

>>> N4A-SERVICES <<<