Pages

Sunday, December 03, 2017

Weekly Review - 04th Monday, 2017

Dear All,


>>> The Senate passed the massive GOP tax bill <<<

The US Senate passed the Tax Cuts and Jobs Act (TCJA) just after 2 a.m. ET on Saturday, moving the US one step closer to the biggest overhaul of the federal tax code in more than 30 years.
The Senate bill would make sweeping changes to individual and business taxes, while also affecting various industries like healthcare. In all, the cuts total a little less than $1.5 trillion in revenue over 10 years.

Negative for Indian Pharma Industry also :-

Obamacare's individual mandate:- The penalty for not having health insurance created by the Affordable Care Act, or Obamacare, would be abolished . The Congressional Budget Office says this would result in 13 million more people without coverage by 2027.

The corporate tax rate would become 20%:- This would plunge from the current 35% and, unlike the individual provisions, would be permanent.

Allow businesses to fully deduct business expenses:- Firms could fully deduct business expenses as soon as they spend money, an increase from the current 50% cap.

Increase the child tax credit:- The credit would jump to $2,000 per child from the current $1,000.

Increase the threshold for the alternative minimum tax :- The bill would raise the income level at which a tax filer would need to use the AMT, a parallel set of tax rules designed to ensure wealthy people don't take large enough deductions to eliminate their entire tax bill.

Change the inflation adjustment for individual tax brackets:- The bill would switch the rate of growth for tax brackets to the chained consumer price index from the normal consumer price index (CPI). Typically, chained CPI grows as a slower rate.

Give a deduction for pass-through businesses:- Businesses in which the owner takes the profits from the firm as income are known as pass-throughs (like limited liability corporations or S-corporations). These firms would be able to take a 23% deduction on this income. There are guardrails to make sure this does not apply to professional service firms like accounting firms or hedge funds.

The standard deduction:- The Senate TCJA would almost double the standard deduction to $24,000 for married filers and $12,000 for single filers.

The medical expense deduction: - Currently, if a person's annual medical expenses are above 10% of their qualified income, the amount above that threshold can be deducted. The Senate bill would temporarily lower that to 7.5% of income through 2018.

The estate tax:- Currently, if the estate of an individual is greater than $5.6 million, that person's heirs must pay taxes above that level. The bill would increase that threshold to $11 million.

The state and local tax deduction:- Taxpayers will be able to deduct up to $10,000 in state property taxes, but could no longer deduct state and local income or sales taxes.

Suspend a slew of itemized deductions and exemptions:- Tax breaks for everything from moving to commuting by bike would be eliminated.

>>>Week Ahead :-<<<

The outcome of the Reserve Bank of India's (RBI) monetary policy meeting, macroeconomic data, trend in global markets, investment by foreign portfolio investors (FPIs) and domestic institutional investors (DIIs), the movement of rupee against the dollar and crude oil price movement will dictate trend on the bourses next week.
The RBI's monetary policy committee (MPC) will meet on Tuesday, 5th and Wednesday, 6th December 2017 for the fifth bi-monthly monetary policy decision for FY 2018. The resolution of the MPC will be placed on the RBI website at 14:30 IST on Wednesday, 6 December 2017.

In the previous meeting on 4 October 2017, the RBI kept the policy repo rate under the liquidity adjustment facility (LAF) unchanged at 6% on the basis of an assessment of the current and evolving macroeconomic situation. Consequently, the reverse repo rate under the LAF remains at 5.75%, and the marginal standing facility (MSF) rate and the bank rate at 6.25%.

On the macro front, Markit Economics will unveil the result of a monthly survey on the performance of India's services sector in November 2017 on Tuesday, 5 December 2017.

On the global front, US ISM non-manufacturing purchasing managers index (PMI) data for November 2017 will be unveiled on Tuesday, 5 December 2017.

US ADP nonfarm employment change data for November 2017 will be unveiled on Wednesday, 6 December 2017.

Japan Q3 gross domestic product (GDP) data will be unveiled on Thursday, 7 December 2017.

US nonfarm payrolls data and US unemployment rate data for November 2017 will be unveiled on Friday, 8 December 2017.

>>> Nifty Weekly Chart <<<

>>> Click the chart to see on full screen <<<

Price tends to break the interim support channel, If breaks May possibly test 10015.

>>> Nifty Daily Chart <<<

>>> Click the chart to see on full screen <<<

Resisted @ 10405 - and breaks important supports, might be moving as Wave C.

>>> Bank Nifty Daily Chart <<<

>>> Click the chart to see on full screen <<<

Might be an ABCDE Correction. Support @ 25160 - 24975 - 24700 - 24370. Resistance @ 25350 & 25580.

>>> Bank Hourly Chart <<<

>>> Click the chart to see on full screen <<<

Middle line Support Broken. Resistance @ 25340 - 25460 - - 2550.

>>> CNXIT - Daily Chart - Posted Last Weekly Review <<<

>>> Click the chart to see on full screen <<<

Posted Last Weekly Review - IT Index may Resist @ 11350.

>>> Nifty IT - Daily Chart <<<

>>> Click the chart to see on full screen <<<

Support @ 10800 & 10650.

>>> TechM - Hourly Chart <<<

>>> Click the chart to see on full screen <<<

Classic Expanding Triangle. Break below the Triangle may trigger more Selling.

>>> CNXPSUBank - Daily Chart <<<

>>> Click the chart to see on full screen <<<

After Recapitalization News - Price failed to Move UP. Support @ 3745 and 3600.

>>> SBIN - Hourly Chart <<<

>>> Click the chart to see on full screen <<<

SBIN may consolidate further. Support @ 310 & 300. NO Holdings.

>>> CNXPHarma - Hourly Chart <<<

>>> Click the chart to see on full screen <<<

US - Senate passed a massive tax reform bill overnight on Saturday. Major Changes to the Code in the Bill - Says - The penalty for not having health insurance created by the Affordable Care Act, or Obamacare, would be abolished - Must a Big NEGATIVE for INDIAN Pharma Industry also CAUTION ADVISED ON ALL PHAMRA STOCKS.
9003 and 9045 Support. Below 9000 More fall likely.

>>> SUNPHARMA - Daily Chart <<<

>>> Click the chart to see on full screen <<<

Many queries about Sunpharma Since we booked Profit last week. Above chart - doesn't look in good shape. Channel Resisted and if breaks below 510 or 500 may trigger a good Sell off. Caution Advised.

>>> CNXMetal - Hourly Chart <<<

>>> Click the chart to see on full screen <<<

Metal Index Breached Crucial Support 3640 - May test 3510-3500.

>>> VEDL - Hourly Chart - Posted Last Weekly Review <<<


>>> Click the chart to see on full screen <<<

Mentioned Support Line 294.

>>> VEDL - Hourly Chart - Broken Support - More Rall Likely <<<

>>> Click the chart to see on full screen <<<

Stop Loss hit and Exited with a Loss of Rs.3500/-

>>> CNX Financial Service Index <<<

>>> Click the chart to see on full screen <<<

Financial Service Index - Might break down below 13300.

>>> LICHSGFIN - Weekly Chart <<<

>>> Click the chart to see on full screen <<<

Hit SL earlier and Exited. Trend Line may support the Price.

>>> Performance so far in Dec 2017 <<<


Above performance is not a Promise or guarantee for the given Profits or Loss.Performance given based on 1 lot at a time and clients Profit differ as per the margin availability and Number of Lots taken by them. We may or may not re-enter the Calls given here hit Stop Loss, as per market movement. The charts given above are just for educational purpose only and we don't recommend any Entry / Buy or Exit / Sell. Reader must taken their own decision or consult their qualified Analyst before making any decision

>>> N4A - Whatsapp <<<


Send Registration Request with Name and Location. Existing Members - If not getting messages - Save our number - Clean Your whatsapp and ping.


Thursday, November 30, 2017

Support @ 10200 - 10160 - 10090

Dear All,

>>> Nifty Hourly Chart <<<

>>> Click the chart to see on full screen <<<

Support 10200 - 10160 - 10090 must decide the Trend.

>>> Bank Nifty Hourly Chart <<<

>>> Click the chart to see on full screen <<<

Lets wait and see how the GDP data and Channel Support Helps the Bank Nifty.

>>> VEDL - Hourly Chart <<<

>>> Click the chart to see on full screen <<<

Support Line if holds - Expect a good bounce back rally. Cheers!!!

>>> N4A - Whatsapp <<<


Tuesday, November 28, 2017

Support @ 10350 - 10320 - 10300

Dear All,

>>> Nifty 5 Mins Chart <<<

>>> Click the chart to see on full screen <<<

Above is a 5 Mins chart. Price Resisted @ 10405 again and Support @ 10350 - 10320 - 10300.

>>> Bank Nifty 5 mins Chart <<<

>>> Click the chart to see on full screen <<<

BN Spot Must hold 25800 & 25760 for upmove.

>>> NIFTY - IT Hourly Daily Chart <<<

>>> Click the chart to see on full screen <<<

Unless 11350 takes out - IT Index on trouble. We have Short Positions. Cheers!!!

Sunday, November 26, 2017

Weekly Review - 27th Nov, 2017

Dear All,


>>> Key to Successful Investment Strategy :-

The key to any successful investment strategy is knowing the delicate balance between your comfort level and risk against a specified time horizon.

1. Accept responsibility :-

Was the last bad trade one of your single biggest losses? Was it your first ever significant financial loss? If so, be sure to own it. Losses are part of any investment strategy. It happens to the best investors.

Don’t simply brush it aside. Learn from it. Don’t continue investing until you have. Know what happened and don’t simply blame market volatility for your loss. Take ownership of what happened.

Honestly assessing your actions and determining the consequences of those actions will allow you to make better future decisions. Despite the difficulty of trying to counter how this loss will impact you, learn from it. This will allow you to control your investment trading. It will also keep single losses from turning into a massive losing streak.

2. Stop trading :-

When a bad trade happens, especially one that has significant impact, stop trading. Seriously. The mechanisms of our ego defense system will immediately use emotion to try and recoup your loss. Trying to find a better trade when you’re emotionally invested will just lead to further losses.

Instead, walk away from trading. Find a way to work out your frustrations. For some, that may be going for a run, and for others a yoga class. Find the method that best allows you to remove negative emotions from your environment.

Stop all trades for a few days. Rather conduct simulated trades to allow yourself to get back into strategic investing. This will clear any psychological and emotional hurdles the last bad trade may have left behind.

3. Refocus :-

When you have rid yourself of negative emotions, use the bad trade as motivation. Return small when resuming live trading to make sure you do not allow emotions to dictate an attempt to recoup your losses.

A professional approach is to resume trading to get you back to the level of success you were at before your bad trading day. Refocusing after a bad loss means regaining your investment strategy again to start acquiring safe, steady gains.

4. Have a plan :-

After finding your focus and building up your confidence, make a detailed action plan for future trades. This will allow you to understand what went wrong. Establish limits within your detailed action plan. As most bad trades could be quantifiable because of key market actions, identify the factors within your bad trade that could be quantified for profitable gains.

A bad trade should be used as a catalyst to improve your trading strategy.

5. Put your loss into perspective :-

Seasoned traders understand that losses are part of a trader’s routine. Bear markets are normal, but so are bull markets. Inexperienced traders may try to trade through the embarrassment and pain of a bad trade.

It’s important to put this loss into a perspective. Remember that a bad trade is simply that, a bad trade. It’s moments like this that self-reflection are important. Bad trading days are also a good time to remind you of the successes you’ve had through both bull and bear markets.

Much like other aspects of daily life, there’s a lesson in financial losses. A bad trade may be the economic loss you need as a trader to thrive into new opportunities.

No trade is without its risks. The potential of a trade is determined by quantifiable key market actions. Regardless of this, loss will occur. It’s how you learn and develop from that loss that will determine your success as a trader.

>>> Week Ahead <<<

Auto Sales :-

With December arriving next week, the focus could shift to auto sales. The market will look forward to the numbers as this will not include the festive season sales, which had been one of the key drivers in the past two months.

Going forward, the Street will take cues from these figures in a bid to gauge the consumption trends in the country as well. Auto stocks could be in focus. The sectoral index has been trading flat so far in November, while on a yearly basis, this has seen 22 percent increase.

S&P rating :-

The Street could react to the unchanged rating by global ratings agency S&P as it was factoring in either a status quo or an upgrade. It will also watch out for commentary on the Narendra Modi government’s efforts at the macro-economic level.

Macro data :-

On the domestic front, the Street will look forward to the quarterly GDP data figures for India, which will be declared on November 30.

Over and above this, the manufacturing purchasing managers’ index will be out during the next week, which will help in gauging the manufacturing activity in the country. Positive cues from these data points could help the Street push up to fresh bullish points.

US’ GDP data in the US, CPI data, crude oil imports, and manufacturing PMI could also keep the Street on its feet.

FII data :-

Foreign institutional investors (FIIs) sold shares worth Rs 416.28 crore compared to domestic institutional investors who bought Rs 427.63 crore worth of shares in the Indian equity market on Friday, data available with the NSE showed.

So far, for the month of November, FIIs have remained net sellers of Rs 10,742.22 crore worth of shares, while DIIs have purchased Rs 7,628.32 crore worth of shares, hinting at the continued support offered by domestic investors.

The Street will watch out for these flows, going forward, especially amid volatility ahead of F&O expiry and US Federal Reserve’s meet lined up next month.

F&O expiry :-

All futures and options contracts for November will expire on Thursday and positions will be rolled over to December.

ICICI Securities believes that the Nifty has been forming a base near 10,300 for the November series. The upmove can be extended till 10,600.

“Call positions are getting added at the 10,600 strike, which remains the target for the index. Closure was seen in the Nifty and Nifty Bank futures, which shows the short covering pattern seen in these indices,” the brokerage said in its report.

>>> Nifty Daily Chart <<<

>>> Click the chart to see on full screen <<<

In January 2007, S&P had changed India’s rating to BBB-, which is the lowest investment grade rating for bonds. The outlook that it assigned back then was “stable” which it later changed to negative in 2009 and again raised it to stable in 2010, it lauded the Modi government's fiscal consolidation drive and said that the reforms undertaken are favourable for the economy. After Moody's Upgrade - it was widely expected that S&P may too upgrade India's Rating. So fluctuations on Bonds and INR Possible - may reflect Equity too.
Resistance @ 10400 - 10495 - 10590. Support @ 10360 - 10330 - 10300.

>>> Nifty Hourly Chart <<<

>>> Click the chart to see on full screen <<<

Crucial Resistance between 10405-415 - If doesn't breaks - may trigger a good correction.

>>> Bank Nifty Daily Chart <<<

>>> Click the chart to see on full screen <<<

ON the upper side Price retraced almost 150% may test or resist @ 25960. If so, Expect a good correction.

>>> Bank Nifty Hourly Chart <<<

>>> Click the chart to see on full screen <<<

25960 > Above more Rally.

>>> ULTRACEMCO - Posted on 22nd Nov, 2017 <<<

>>> Click the chart to see on full screen <<<

Posted on 22nd Nov, We are Long.

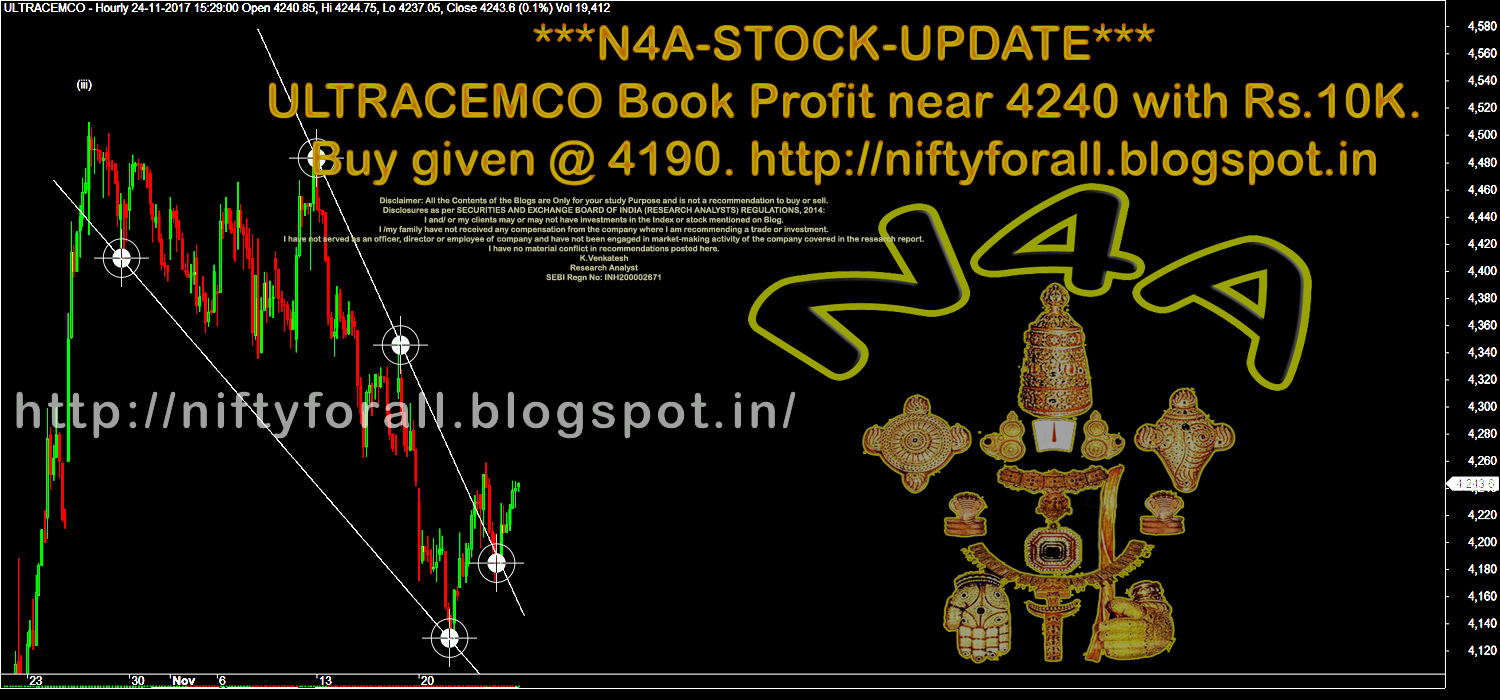
>>> ULTRACEMCO - Booked Profit Rs.10,000/- <<<

>>> Click the chart to see on full screen <<<

Booked Profit Rs.10k.

>>> CNXPSUBank - Hourly Chart <<<

>>> Click the chart to see on full screen <<<

3950 if breaks - Expect Free Fall on all PSU Bank Stocks.

>>> NiftyMidCap50 - Hourly Chart <<<

>>> Click the chart to see on full screen <<<
Support @ 5175 & 5130. Resistance @ 5230 & 5300.

>>> CNXPharma - Hourly Chart <<<

>>> Click the chart to see on full screen <<<
Possible correction if fails to break above 9380 & 9420.

>>> SunPharma - Hourly Chart - Booked Profit Rs.20,000/- <<<

>>> Click the chart to see on full screen <<<
Booked Profit Rs.20,000/-

>>>> N4A - WhatsApp <<<


Send request with name and Location. Existing clients - If not receiving any messages - Must save my number or Ping Back. Cheers!!!


Thursday, November 23, 2017

Resistance @ 10375 & 10415.

Dear All,

>>> Nifty 5 Mins Chart <<<

>>> Click the chart to see on full screen <<<

Volatile Move - Hence 5 mins chart give - tried best to find out the direction. Resistance @ 10375 and 10415. Support @ 10290-300.


Wednesday, November 22, 2017

Resistance @ 10340 - 380

Dear All,

>>> Nifty Hourly Chart <<<

>>> Click the chart to see on full screen <<<

Price may rally above the triangle break out.

>>> ULTRACEMCO - Hourly Chart <<<

>>> Click the chart to see on full screen <<<

Holding Long and Looking for More Rally. Cheers!!!

Tuesday, November 21, 2017

Not Holding Above 10340

Dear All,

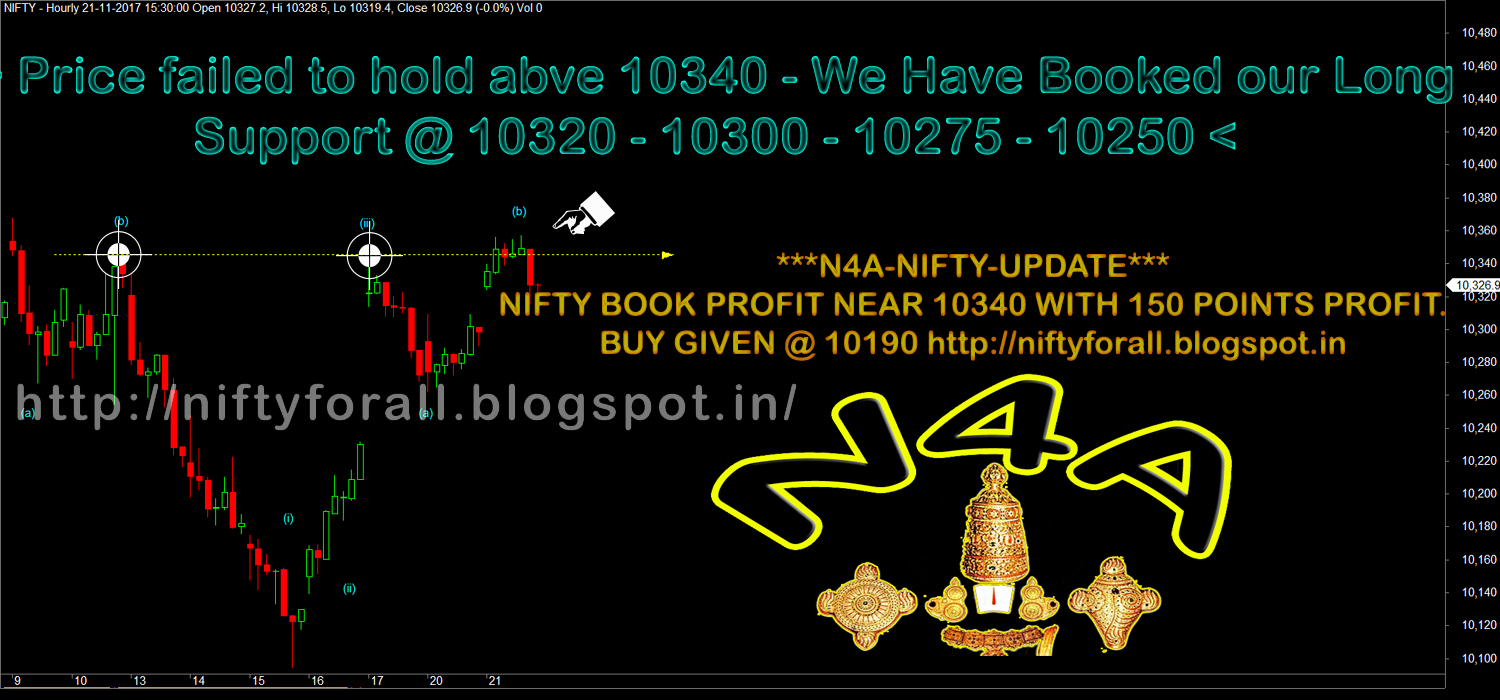
>>> Nifty Hourly Chart <<<

>>> click the chart to see on full screen <<<

We have booked our Long today with 150 Points Profit. Price may consolidate further if unable to cross above 10340 again.

>>> Bank Nifty Hourly Chart <<<

>>> click the chart to see on full screen <<<

Must cross above 25925 for further upmove. Booked our Long with 490 Points Profit.

>>> SunPharma - Posted on Weekly Review <<<

>>> click the chart to see on full screen <<<

Posted on Weekly Review - We are Long.

>>> SunPharma - Hourly Chart - Booked Profit Rs.20,000/- <<<

>>> click the chart to see on full screen <<<

Booked Profit with Rs.20000/-.


Sunday, November 19, 2017

Weekly Review - 20th November - 2017

Dear All,


Here are the seven most common errors traders make in a bull market.

They wait for a correction to get long that never happens. So they end up missing a big part of the up trend.
They do not get long with a big enough position size or enough leverage so they end up underperforming the market.
They do not buy the small dips when they get a chance.
Perma bears do not believe in the bullish move higher so they sell short losing money in a market where it should be made easily by being long.
Some fundamentalists think the market is too expensive so they stay in cash missing a strong up trend as they wait for buying opportunities at better values.
When the dip they were waiting for finally happens they are too scared to buy it and they then begin to fear that the market will crash.
Instead of making money too many get obsessed with calling a market crash because they believe the market prices are too damn high.
The best strategy for a bull market is to not fight it but instead sit back and enjoy the ride.

>>> Key Events :- <<<

After Moody's, other rating agencies' move will be watched

India's sovereign credit rating upgrade by Moody’s to 'Baa2' from 'Baa3' for first time since 2004 and change in its outlook on the rating to stable from positive, citing continued progress in economic and institutional reforms on Friday cheered the markets.Now the market will watch that the move of other rating agencies.
Currently Standard and Poor's has a BBB- rating on India since 2007 and stable outlook. It had upgraded India's sovereign rating to stable from negative in 2014, especially after Modi government came in power.Fitch has kept its BBB- rating unchanged for 11 years on India, and retained stable outlook since 2013.BBB- is one notch above Junk.

Macro Data :-

Consumer price index for rural and farm labourers for October will be released on November 20. Crude, refinery output for October and Mobile subscriber data for October will be announced during November 20-24. Foreign exchange reserves for the week ended November 17 and bank loan growth & deposits growth for the week ended November 10 will be announced on Friday.

FIIs & DIIs flow and F&O Data :=

Foreign institutional investors bought nearly Rs 6,000 crore worth of shares and DIIs purchased Rs 3,451 crore worth of equities in the week gone by, due to stable September quarter earnings and Moody's India rating upgrade.

On Friday, maximum Call open interest (OI) of 59.98 lakh contracts was seen at strike price 10,500, which will act as a crucial resistance level for the index in the November series, followed by 10,400, which now holds 51.68 lakh contracts in open interest, and 10,600, which has accumulated 42.81 lakh contracts in OI.

Maximum Put OI of 48.77 lakh contracts was seen at strike price 10,000 which will act as a crucial base for the index in November series, followed by 10,200, which has accumulated 47.69 lakh contracts in open interest, and 10,300, which now holds 46.23 lakh contracts in open interest.

Global Cues :-

Japanese trade balance data (imports and exports) will be announced on Monday. US existing home sales data will be released on Tuesday while US durable goods orders, US unemployment claims, US crude oil inventories and US FOMC meeting minutes will be announced on Wednesday.

Europe's Manufacturing and Services PMI, and ECB Monetary Policy Meeting Minutes will be unveiled on Thursday.Japan's Manufacturing PMI, and US Manufacturing and Services PMI data will be released on Friday.US and Japanese markets will remain shut on Thursday for Thanksgiving Day.

>>> Nifty Daily Chart <<<

>>> Click the chart to see on full screen <<<

Above 10340 - 10400 More rally and New High Possible.

>>> Nifty Hourly Chart <<<

>>> Click the chart to see on full screen <<<

Possible double top or Resistance 10340 must be crossed again for a fresh rally. Key Support @ 10260 and 10240.

>>> Bank Nifty Daily Chart <<<

>>> Click the chart to see on full screen <<<

Above 25925 - More Rally Again.

>>> Bank Nifty Hourly Chart <<<

>>> Click the chart to see on full screen <<<

Support @ 25640 - 25580 - must hold. Resistance 25925 if breaks again may trigger next round of rally.

>>> Nifty MidCap50 - Daily Chart <<<

>>> Click the chart to see on full screen <<<

MidCap Index mainly contains Financials and Infra Stocks. After Moody's Upgrade and Govt. Commitment to Help PSU Banks - Lifting the Midcap sentiments. 5120,5105 and 5090 to give support. Above 5175 - Fresh Rally Possible.


>>> CNXIT - Daily Chart <<<

>>> Click the chart to see on full screen <<<

A new legislation in the United States—which proposes to increase minimum wages, paid to foreign tech workers employed in the country on H1B visas, from $60,000 to $90,000—has set off alarm bells in India with the National Association of Software and Services Companies (NASSCOM), saying that the proposed law is “arbitrarily targeting” Indian companies which took up only a small portion of these visas last year.

Major Indian IT companies paid project managers between $85,000 and $130,000 in the US last year — with salaries varying between US states — while technology leads were paid between $65,000 and $100,000, and systems engineers around $ 65,000, according to data available online.

Above news doesn't sounds good for Indian IT Companies. Above chart suggest if breaks the support - Possible sell off in all IT companies.

>>> CNXPharma - Hourly Chart <<<

>>> Click the chart to see on full screen <<<

Pharma Index Support @ 9130-9107-9080 - If holds - May bounce again. Watch all Pharma Stocks

>>> SunPharma - Hourly Chart - Holding Long <<<

>>> Click the chart to see on full screen <<<

Support @ 514 - 511 - 506 if holds - upmove possible.

>>> CNXPSUBanks - Daily Chart <<<

>>> Click the chart to see on full screen <<<

Only above 4190 - Rally may start.

>>> N4A - Whatsapp <<<

Send your request with name and Location. Those who already registered - If not receiving messages - Should save this number and ping us.