Pages

Wednesday, August 10, 2016

Support @ 8560 & 8520 Must Hold for Upmove

Dear All,

>>> Nifty Hourly Chart <<<

>>> Click the chart to see on full screen <<<

Next Support @ 8560 & 8520 must hold to help the bulls.

>>> CENTURYTEX - Posted Yesterday <<<

>>> Click the chart to see on full screen <<<

Posted Yesterday - Wrote about a Possible correction. See what happened.

>>> CENTURYTEX - Profit Booked Rs.44000/- <<<

>>> Click the chart to see on full screen <<<

Booked Profit today Rs.44000/-

>>> AMBUJA - Posted on Weekly Review <<<

>>> Click the chart to see on full screen <<<

Wrote on weekly Review also - Ambuja may correct any time. See what happened.

>>> AMBUJA - Follow Up - More Correction Possible <<<

>>> Click the chart to see on full screen <<<

Holding for More correction.

>>> ASIAN PAINT - Daily Chart <<<

>>> Click the chart to see on full screen <<<

Asian Paint - May correct - If price breaks the given support line on chart. Lets Wait and See. Cheers!!!

Tuesday, August 09, 2016

Next Resistance @ 8760-80. Support @ 8560 & 8520

Dear All,

>>> Nifty Hourly Chart <<<

>>> Click the chart to see on full screen <<<

Price Need to break on either side for confirmation. Resistance @ 8760-80 or Support @ 8560-20

>>> CENTURYTEX - Daily Chart <<<

>>> Click the chart to see on full screen <<<

Price unable to cross above the wedge channel for 3rd time. If the Support channel breaks - Expect a good correction. Cheers!!!

Sunday, August 07, 2016

Weekly Review 08th August, 2016

Dear All,


Nifty was sluggish through out the week, managed to bounce back on friday supported by Liquidity gush in the system. The PMI data points towards an acceleration in the economy. The macro indicator suggests whopping 5.2 per cent expansion in July as against 2.8 per cent in May and 2.8 per cent in the corresponding previous year. Markets too are continuously discounting the encouraging macroeconomic numbers. July automobiles growth numbers surprised the Street.

Key events of the week: Foundation for the historic path-breaking tax reform has been laid down last week. Now the superstructure will be built over a period of time through the state approvals etc. GST will truly lead India to accelerated corruption free inclusive growth for the masses in the country.

Far reaching amendments were cleared by the law makers for speedy and hassle free debt recovery in a time bound manner further enhancing the Bankruptcy Code for making India Bad Debt free economy.

There was covering of short positions with the clearance of the GST Bill in the Rajya Sabha and the quantitative easing by the Bank of England also aided the rally. Most of the gains were led by the Indian consumption sectors such as auto and financials among others.

The Bank of England on Thursday reduced its benchmark interest rate to a record low of 0.25% from 0.5%, the lowest in its 322-year history.

The India Meteorological Department on Thursday said that monsoon rains during the week from 28 July to 3 August 2016 was above long period average (LPA) by 6%.

Further, reports suggest that the government is likely to table the GST Bill in the parliament on Monday, August 8. The target for the rollout of the GST Bill is scheduled for April 01, 2017.

>>> Open Interest Index Futures <<<

The week gone by marked the beginning of the August Expiry. Since 29th July, FII and PRO combined have bought 1711650 shares in Index Futures. This indicates that big players are building long positions in market. Entire week saw a continuous below average buying in Index Futures.


>>> Open Interest Index Options <<<

The week gone by marked the beginning of the August Expiry. Since 29th July, FII and PRO combined have sold 107913975 shares in Index Options. Market witnessed profit booking for the entire week except on Friday, where the bulls took over the control again with an above average buying of 6692925 shares in index options.


The week gone by marked the beginning of the August Expiry. Since 29th July, FII continued its buying spree in the cash segment with a buy totaling worth Rs. 2821 cr. DII, on the other hand stood opposite with a net sell worth RS. 1361 cr in the same period. Combined, shares worth Rs. 1460 cr were bought for the week.


The combine FII and Pro have seen a continued increase in long position in Index future and an increase of Short position in index options. In the cash segment FII and DII combined are net buyers of Rs. 1460 Cr since 29th July 2016

Let's See Technical.

>>> Nifty Weekly Chart <<<

>>> Click the chart to see on full screen <<<

Price closed above previous high 8654 and RSI gave a Break out. Key Resistance 8710-20 must give a confirmation to bulls for a Go ahead Rally.

>>> Nifty Daily Chart <<<

>>> Click the chart to see on full screen <<<

RSI took support from the trend line, must cross above trend line for a break out confirmation. Price must cross and close above 8720 for a healthy rally.

>>> Nifty Hourly Chart <<<

>>> Click the chart to see on full screen <<<

RSI continue to make a LH while Price making a HH. Next week if RSI gives a break out - Expect a good short covering and rally.

>>> Bank Nifty Daily Chart <<<

>>> Click the chart to see on full screen <<<

Price making a throw back rally - after a break down with RSI.

>>> SBIN - Follow Up <<<

>>> Click the chart to see on full screen <<<

Price making an upmove - may face resistance @ 235.50.

>>> JUSTDIAL - Posted Last Weekly Review <<<

>>> Click the chart to see on full screen <<<

Last Weekly Review Updated Just Dial as a Break Out - See what happened.

>>> JUSTDIAL - Break Out Failed & SL Hit <<<

>>> Click the chart to see on full screen <<<

Break Out Failed. SL hit and Exited with Loss.

>>> AMBUJA - Posted on 03rd Aug, 2016 <<<

>>> Click the chart to see on full screen <<<

Wrote on 03rd Aug, 2016, Ambuja completed ABC wave and may have a possible correction.

>>> AMBUJA - Follow Up <<<

>>> Click the chart to see on full screen <<<

Cross and close above the channel may reverse the trend and current count and analysis get negated.

>>> Performance till 05th Aug, 2016 <<<

>>> Click the chart to see on full screen <<<
Above performance is not a Promise or guarantee for the given Profits or Loss. Performance given based on 1 lot at a time and clients Profit differ as per the margin availability and Number of Lots taken by them. We may or may not re-enter the Calls given here hit Stop Loss, as per market movement. The charts given above are just for educational purpose only and we don't recommend any Entry / Buy or Exit / Sell. Reader must taken their own decision or consult their qualified Analyst before making any decision.


Wednesday, August 03, 2016

Support @ 8530 & 8480

Dear All,

>>> Click the image to see on full screen <<<

Above image shows - how the GST Bill impacted the Other Nations during the year its introduced. So also to us, hope every one can understand what may happen for us, But as per news it looks like GST will be Introduced from FY17.

>>> Nifty Hourly Chart - Posted Yeserday <<<

>>> Click the chart to see on full screen <<<

Wrote Yesterday - Price resisted @ 8710 and may see a possible correction - if not crossed above it.

>>> Nifty Daily Chart - Happened <<<

>>> Click the chart to see on full screen <<<

Price made a first sign of Bearishness, and if RSI confirms the same, More correction possible.

>>> Bank Nifty - Daily - Posted on 01st August, 2016 <<<

>>> Click the chart to see on full screen <<<

Wrote many times - Bank Nifty unable to cross our resistance and broken down for a correction. See what happened.


>>> Bank Nifty - Happened <<<

>>> Click the chart to see on full screen <<<

We are short in Bank Nifty above 19000 and still holding for a Good Correction

>>> AMBUJA - Daily Chart <<<

>>> Click the chart to see on full screen <<<

We hope that the Current rally on Ambuja has been completed as ABC wave and looks like it may correct. We have shorted Ambuja and holding it for a good correction. Cheers!!!

Tuesday, August 02, 2016

GST Vs Nifty ?!?!?

Dear All,

>>> Nifty Hourly Chart <<<


>>> click the chart to see on full screen <<<

GST news to ride the market tomorrow. Charts shows a break down signal. Lets wait and see.

Monday, August 01, 2016

Key Support @ 8580-8590

Dear All,

>>> Nifty Hourly Chart <<<

>>> Click the chart to see on full screen <<<

Price today breached a one month support line and managed to hold at the end of the day. Tomorrow 8580-90 acts a good support, if holds, price may continue its upward journey.

>>> Bank Nifty Daily Chart - Posted on Weekly Review <<<

>>> Click the chart to see on full screen <<<

Mentioned on weekly Review - Price close the wedge support line. See what happened today.

>>> Bank Nifty Daily Chart - Happened <<<

>>> Click the chart to see on full screen <<<

So Price broken the wedge - if stay below, Correction may continue. We are holding short.

>>> SBIN - Hourly Chart <<<

>>> Click the chart to see on full screen <<<

So again Price broken the Wedge - Hope SBIN may correct. Cheers!!!

Saturday, July 30, 2016

Weekly Review - 01st August, 2016

Dear All,


The Bank of Japan has announced a modest expansion of its monetary easing programme, blaming Britain’s decision to leave the European Union as the biggest uncertainty facing world markets.

The central bank acknowledged government pressure for more action to drive the yen lower and help Japan’s legion of exporters, but stopped short of upping its bond purchases or cutting interest rates.

“Against the backdrop of the United Kingdom’s vote to leave the European Union and the slowdown in emerging economies, uncertainties surrounding overseas economies have increased and volatile developments have continued in global financial markets,” the bank said in a statement eagerly awaited by investors around the world.

The bank had acted “in order to prevent these uncertainties from leading to a deterioration in business confidence and consumer sentiment”.


Some market experts said the lack of bold action suggested the bank had decided that the effectiveness of its huge monetary easing programme had reached its limits.

“Is this guidance that we may actually see negative rates being reversed? I suspect it could be,” he said in a note to clients. “It’s obvious that there has been a mini credit crunch in Japan and the banks have underperformed. Negative rates haven’t worked, in fact they have been a huge negative.”

Japanese officials were under intense pressure to deliver as economists increasingly write off prime minister Shinzo Abe’s faltering bid to fire up the world’s number three economy, dubbed Abenomics.

The UK referendum result in June hammered financial markets and sparked a yen rally that is threatening corporate Japan’s bottom line – and aggravating concerns about growth.

Abe announced a huge $266bn fiscal stimulus for the economy on Wednesday but government figures on Friday morning underlined the scale of the problems facing the country.

Spending by households across the country fell in June while inflation dropped for a fourth straight month, in a fresh blow to Abe’s war on deflation.

But the Bank of Japan said it would maintain its base money target at 80 trillion yen ($775bn) as well as the pace of purchases for other assets including Japanese government bonds.

It also left unchanged the 0.1% interest it charges to a portion of excess reserves financial institutions park with the central bank.

The BOJ said it would increase exchange-traded funds purchases so that its total holdings increase at an annual pace of 6 trillion yen ($57bn), up from the current 3.3 trillion yen. The decision was made by a 7-2 vote.

“The BOJ believes that its monetary policy measures and the government’s initiatives will produce synergy effects on the economy,” the bank said.

Business confidence has slumped to levels last seen when Abe won power in late 2012 on a ticket to fire up an economy beset by years of falling prices and weak growth.


>>> Morgan Stanley Warns Currency Traders Worst to Come for Dollar <<<

The dollar is set to fall 5 percent in the next few months, the Federal Reserve isn’t raising interest rates anytime soon and U.S. economic data is only going to get worse. That’s what Morgan Stanley chief global currency strategist Hans Redeker told clients in a note published Thursday, citing in-house indicators showing U.S. domestic demand is set to fade in the coming months. It didn’t take long for markets to prove him prescient. The greenback fell 1.3 percent Friday, capping its worst week since April, after the Commerce Department said U.S. second-quarter gross domestic product advanced at about half the rate economists had forecast.


“We are quite pessimistic about, first, the outcome of the U.S. economy,” Redeker said in an interview on Bloomberg Television Friday, before the GDP report’s release. “When you look at our internal indicators, which capture domestic demand very well, they are suggesting that the demand strength is going to fade from here.”

The greenback had rallied in recent weeks on mounting speculation the Fed will hike rates in the coming months following better-than-expected data on jobs, retail sales and industrial production. Dollar bulls’ hopes were dampened Wednesday after a lukewarm policy statement from Fed officials that signaled only a gradual pace towards tighter monetary policy. They were dashed after Friday’s GDP print, which showed a 1.2 percent annualized increase in the April-June period, less than the 2.5 percent median forecast of economists surveyed by Bloomberg.

Further dollar strength will be limited as policy divergence between the U.S., Japan and Europe slows, according to Steven Englander, global head of Group-of-10 currency strategy at Citigroup Inc.
“The dollar still benefits when U.S. growth looks OK, but call it a limping divergence trade, not the kind of divergence trade we were talking about last year or the year before,” Englander said Friday on Bloomberg Television.

>>>> Nifty Daily Chart <<<

>>> Click the chart to see on full screen <<<

Price may face resistance near 8670 and 8705-8710.

>>> Nifty Hourly Chart <<<

>>> Click the chart to see on full screen <<<

Price must Cross the resistance given on channel 8670,8690 & 8710 next week to continue the rally.

>>> Bank Nifty Daily Chart <<<

>>> Click the chart to see on full screen <<<

Price if breaks the wedge, possible may invite sell off.

>>> Bank Nifty Hourly Chart <<<

>>> Click the chart to see on full screen <<<

Price if breaks the trend line again - Correction possible.

>>> DRREDDY - Posted on Last Weekly Review <<<

>>> Click the chart to see on full screen <<<

Wrote last weekly review - DrReddy Lab may correct. See what happened.

>>> DRREDDY - Booked Profit <<<

>>> Click the chart to see on full screen <<<

Probably we have exited and booked a bit earlier, when we saw the Price fell till 2930 on friday. Hope many readers might have shorted and enjoyed the stock.

>>> JUSTDIAL - Daily Chart <<<

>>> Click the chart to see on full screen <<<

We are Long in Just Dial - Price broken out from a Falling wedge and Expect a Rally if price continues to stay above the channel. Cheers.

>>> Performance for the month end of July 2016 <<<

>>> Click the chart to see on full screen <<<

Above performance is not a Promise or guarantee for the given Profits. Performance given based on 1 lot at a time and clients Profit differ as per the margin availability and Number of Lots taken by them. We may or may not re-enter the Calls given here hit Stop Loss, as per market movement. The charts given above are just for educational purpose only and we don't recommend any Entry / Buy or Exit / Sell. Reader must taken their own decision or consult their qualified Analyst before making any decision.

Thursday, July 28, 2016

Resistance @ 8690 & 8720

Dear All,

>>> Nifty Hourly Chart <<<

>>> Click the chart to see on full screen <<<

8690 & 8720 - as Resistance on Friday.

>>> Bank Nifty Hourly Chart <<<

>>> Click the chart to see on full screen <<<

19050-19150 Not able to cross for many days - So lets watch it for Next...Cheers!!!

Wednesday, July 27, 2016

Support @ 8580 & 8540. Resistance @ 8630 & 8660

Dear All,

>>> Nifty Hourly Chart <<<

>>> Click the chart to see on full screen <<<

Price need to break again the channel support for a possible correction. Else Price must break above the upper resistance channel for more rally.

>>> BIOCON - Daily chart <<<

>>> Click the chart to see on full screen <<<

Assumed as wave 3 completed. If Price extends above 261.8% more rally may come in. Lets wait and See.

Tuesday, July 26, 2016

Support @ 8575 & 8540

Dear All,

>>> Nifty Hourly Chart - Posted Yesterday <<<

>>> Click the chart to see on full screen <<<

Wrote yesterday - price & rsi must cross above the trend line for a comfortable rally. See what happened.

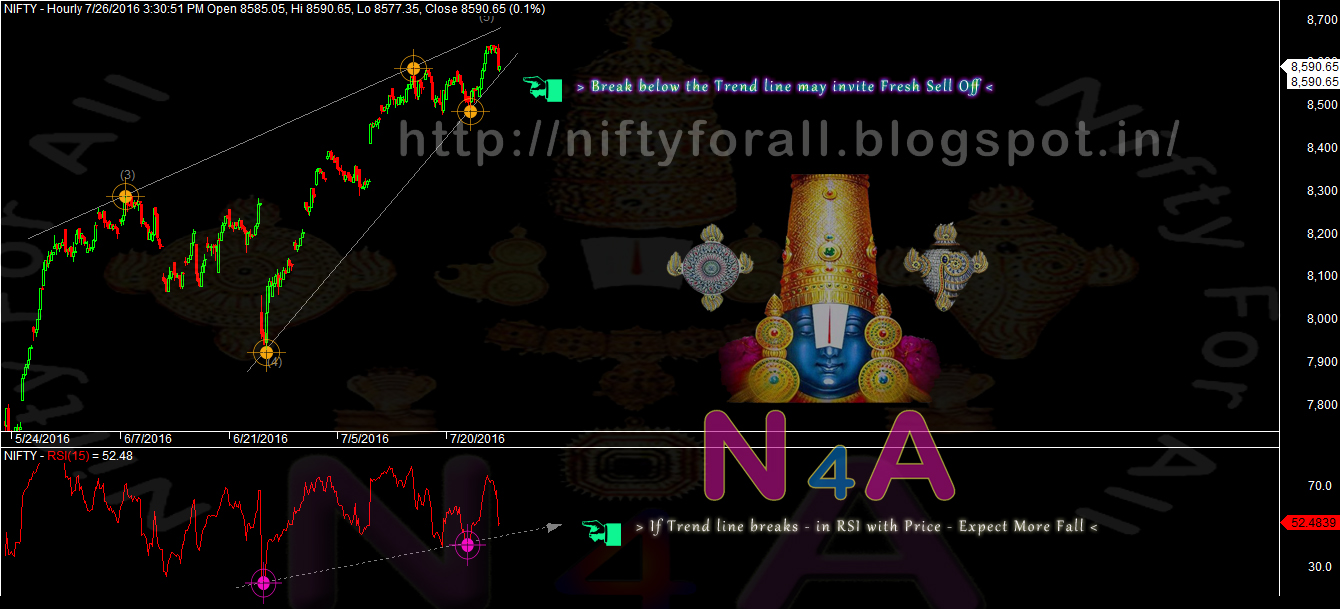
>>> Nifty Hourly Chart <<<

>>> Click the chart to see on full screen <<<

Price unable to cross above the trend line and started moving down. Now the Price and RSI must break below the support for a meaningful correction. Expect heavy volatile ahead of Events like BOJ & FEB along with Expiry. Cheers!!!