Pages

Saturday, January 21, 2017

Weekly Review - 23rd Jan 2017

Dear All,


The market settled lower for the first time in four weeks with the tax relief for foreign portfolio investors (FPIs) and the resolution of dual control issue on Goods and Services Tax (GST) failing to outweigh the negative earnings from financials, International Monetary Fund (IMF)’s 100 basis points cut in growth forecast and global concerns ahead of US president-elect Donald Trump’s swearing-in ceremony. Trump took presidency oath post market hours on Friday

"Till Thursday, Q3 results were coming marginally above expectations and the market was holding a positive view. However, a poor set of numbers led by financials has annoyed the investors turning them cautious. Additionally, commodity stocks are losing their attractiveness due to consolidation ahead the Trump swearing-in ceremony today. IT and Pharma stocks will be keenly watched as the segment may be effected from the upcoming US policies."

Amid ongoing earnings season with Budget 2017 approaching, the market is expected to witness heightened volatility in a holiday-truncated expiry week. Investors will react to Trump’s inauguration speech on Monday, wherein he hinted again at his protectionist stance by reiterating US policy will be to buy American and hire American, while earnings results of heavyweights like, HUL, HDFC, Bharti airtel and Ultratech will also be in focus.

GAAR - New Fear :-

Key benefits given to Foreign Portfolio Investors (FPIs) under amended tax treaties with Singapore, Cyprus and Mauritius may be negated by the implementation of General Anti-Avoidance Rules (Gaar).

Domestic anti-avoidance law will prevail over treaty benefits in the event of a dispute under the Singapore and Mauritius treaties. This could threaten the lower tax rate for FPIs in the two years between April 1, 2017, and March 31, 2019. Under the amended treaties, short term capital gains tax for FPIs is 15%. However, during the transition window cited above, this will be 7.5%, subsequently doubling to 15%. The tax treaties with these countries were amended last year.

Many FPIs are also worried that benefits under the amended treaties for derivatives and debt instruments may be questioned under Gaar. Tax officials confirmed that Gaar will take effect on April 1 and that the government is not looking at issuing any additional regulations before March 31 at a meeting held recently with industry representatives, said people aware of the development.

>>> Nifty Weekly Chart <<<

>>> Click the chart to see on full screen <<<

Weekly Chart suggest a Bull & Bear Struggle ahead in coming weeks. Every one must trade cautiously on Nifty to Protect their capital - as I hope these volatile may continue for many more days.

>>> Nifty Daily Chart <<<

>>> Click the chart to see on full screen <<<

For the second week in a row - Price failed to cross above 8460 and 100 DMA - which triggered sell off, with Trump Fear.

>>> Nifty Hourly Chart <<<

>>> Click the chart to see on full screen <<<

Price broken the expanding triangle - took support @ 8340. Price may try to fill the gap below 8340 Next Week.

>>> Nifty Bank - Weekly Chart <<<

>>> Click the chart to see on full screen <<<

Again in Bank Nifty - Weekly Chart had a mixed signal - Bearish Candle and Bullish MA. So get ready for more volatile in coming weeks.

>>> Nifty Bank - Daily Chart <<<

>>> Click the chart to see on full screen <<<

Price failed to hold 100 DMA after testing 61.8% retrace, may try to test 50DMA and fill the gap left below as shown on chart.

>>> Bank Nifty Hourly Chart <<<

>>> Click the chart to see on full screen <<<

Price if breaks the last channel support - Expect another 400 Points correction to fill the gap left below.

>>> AdaniPort - Posted on 18th Jan, 2017 <<<

>>> Click the chart to see on full screen <<<

Wrote on 18th Jan, 2017 - Adani Port may correct as ABC wave completed. See what happened ?

>>> AdaniPort - Profit Booked on Friday Rs.25000/- <<<

>>> Click the chart to see on full screen <<<

We have booked our short with Rs.25000/- Profit.

>>> Voltas - Shorted & Booked Rs.20,000/- Profit <<<

>>> Click the chart to see on full screen <<<

Booked Rs.20,000/- Profit.

>>> Performance till 20th Jan, 2017 <<<

>>> Click the image to see on full screen <<<

Above performance is not a Pomise or guarantee for the given Profits or Loss.Performance given based on 1 lot at a time and clients Profit differ as per the margin availability and Number of Lots taken by them. We may or may not re-enter the Calls given here hit Stop Loss, as per market movement. The charts given above are just for educational purpose only and we don't recommend any Entry / Buy or Exit / Sell. Reader must taken their own decision or consult their qualified Analyst before making any decision

>>> N4A-SERVICES <<<

Thursday, January 19, 2017

More Consolidation Likely - Key Support @ 8370

Dear All,

>>> Nifty 5 Mins Chart <<<

Price may again test the channel as shown on above chart - 8370 very crucial.

Wednesday, January 18, 2017

Above 8460 - May Test 8510

Dear All,

>>> Nifty Hourly Chart <<<

>>> Click the chart to see on full screen <<<

Price getting more complicated on wave structure for wave C. Above 8460 may test 8510 to fill the gap as shown above.

>>> AdaniPort - Hourly Chart <<<

>>> Click the chart to see on full screen <<<

We have short position from 297 and holding for more such fall. Cheers!!!

Tuesday, January 17, 2017

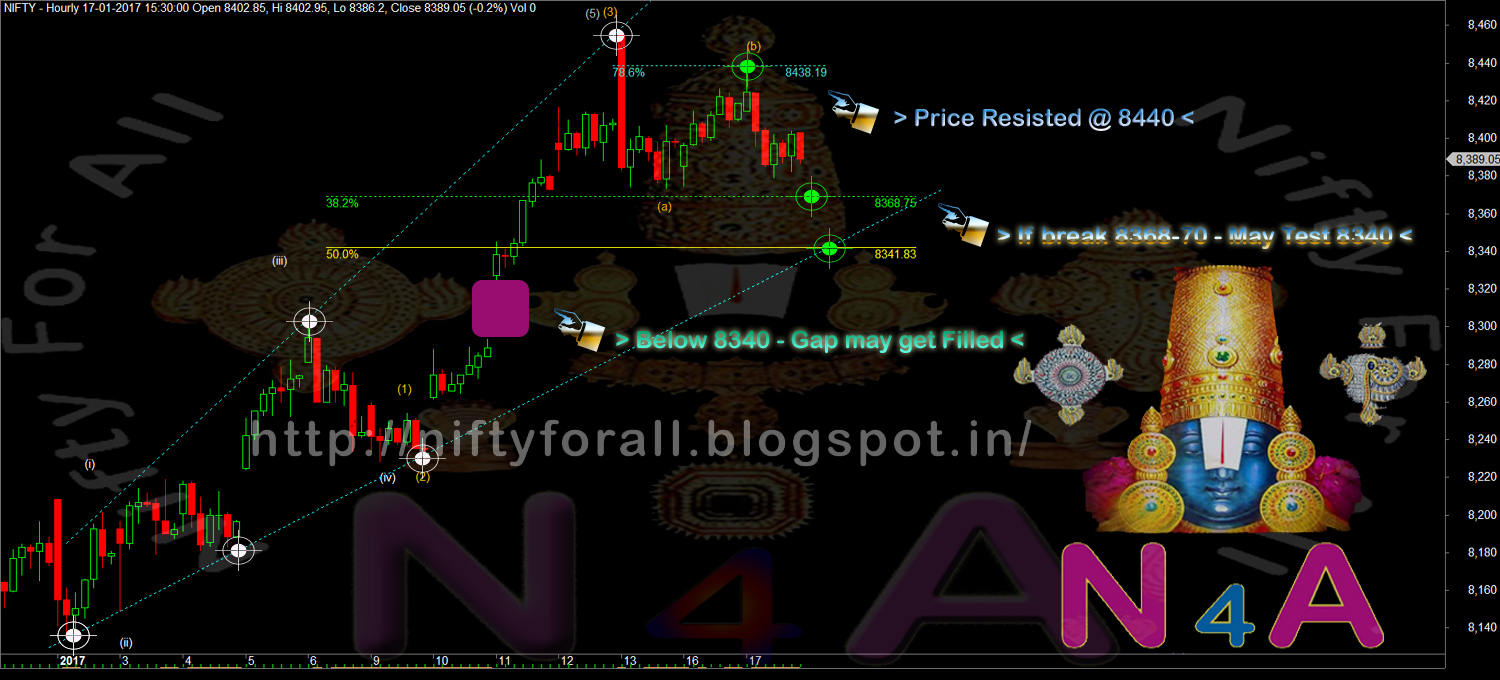
Resisted @ 8440 > If breaks 8368 - May Test 8340

Dear All,

>>> Nifty Hourly Chart <<<

>>> Click the chart to see on full screen <<<

Price resisted @ 8440 and started moving down, If breaks below 8368-70 - May test 8340.

>>> Bank Nifty Hourly Chart <<<

>>> Click the chart to see on full screen <<<

Price almost completed it 1-5 rally, hence if breaks below the channel with RSI - Correction may resume any time.

>>> ITC - Daily Chart <<<

>>> Click the chart to see on full screen <<<

ITC still bargaining on channel top as "abcde" - break above may trigger rally - else correction. Cheers!!!

Monday, January 16, 2017

Resistance @ 8425 & 8438. Support @ 8370 & 8340

Dear All,

>>> Nifty 5 Mins Chart <<<

>>> Click the chart to see on full screen <<<

Price need to cross 8425 & 8438 for a Next upmove. Else may test 8370 & 8340 as shown above.


>>> ITC - Hourly Chart <<<

>>> Click the chart to see on full screen <<<

Break above the channel may give a fresh rally on ITC - as shown above. Lets See.


Saturday, January 14, 2017

Weekly Review - 16th Jan, 2017

Dear All,


President-elect Donald Trump will officially take office on January 20, with an inauguration ceremony scheduled Friday at the US Capitol Building in Washington, DC.

Trump's tenure as US President will be marked by uncertainties involving disruptive policymaking in order to protect jobs for US natives. He is likely to formulate the policies to retain manufacturing jobs in the US.

He has promised to lower corporate tax rates to preserve factory jobs inside the United States, while threatening harsh penalties for companies that produce goods overseas to save on labour costs.

Here's is Trump presidency's likely impact on Indian industries:

IT & Pharma:-

We feel IT and Pharma would be affected adversely due to his protectionist policies.

Speaking of IT & IT-enabled services, Donald Trump's central theme has been to tighten the immigration laws to push for companies to invest and hire more in the US.

A recent re-introduction of bill to prevent companies from hiring H-1B visas is testimony of the changing times. The fear of a stringent immigration policy under Trump is not completely ruled out.

This is evident from his recent appointments who are known to be strong advocates for tighter immigration laws. However, the silver lining is, if the US economy grows through corporate tax cuts or other strategies and the employment grows quickly, there will be demand for IT & back offices services, thus increasing the opportunities as well.

Pharma industry may also be partly affected. Trump has highlighted high prices of drugs and manufacturing overseas as a concern for his administration and warned that he would create fresh bidding procedure for government programs.

However, we don't anticipate larger impact given the share of Indian drug manufactures in value terms.

Metals:-

We anticipate increase in prices of industrial metals in the backdrop of rising infrastructure spends in US which is expected to the tune of USD 1 trillion. This will lead to inflationary pressures in India.

Crude Oil:-

We expect positive developments as Trump may dilute the regulations for the US fracking industry, thus reducing the average cost of production for shale gas.

This will encourage more shale gas production from US firms which would keep the crude oil prices in check despite production cuts from OPEC & Non-OPEC countries.

Fund outflows:-

Now talking of global fund flows to India, we have already seen an exodus of funds from emerging markets including India to US. This includes flows both from debt and equity markets due rising yields as a result of fiscal expansion and monetary tightening policies.

Global concerns:-

On the global concerns not affecting India per se, The President elect has plans to renegotiate or re-evaluate all the foreign trade policies say North American Free trade Agreement (NAFTA) or Trans Pacific Partnership (TPP).

New trade agreements will be negotiated that provide for the interests of US workers and companies first. This would negatively impact countries like Mexico, Canada, China etc.


Important events of the week:-

Tata Group companies, especially TCS, hogged attention after Chandrasekaran’s promotion to Tata Sons’ top post. Experts believe rocking the management boat at this juncture is not prudent as the sector is already facing multiple headwinds.

On the macro front, consumer Price Index-based inflation fell to 3.4% in December versus 3.6% in the previous month, while industrial production belied all expectations of huge adverse impact of demonetisation by rising 13-month high of 5.7% in November against a contraction of 1.8% in the previous month. However, the sharp rise resulted due to lower base effect of November 2015 and a sharp reversal of a 12-month declining trend in capital goods.

Globally, Trump, in his presser, refrained from dropping any clarity on future economic policies, but spoke about scrapping Obamacare, calling for cheaper drugs and pledging higher job opportunities in United States.

MARKET NEXT WEEK:-

The market will await wholesale price index-based inflation data due on Monday, along with key corporate results such as Reliance Industries, HPCL, LIC Housing Finance, Axis Bank, YES Bank and Delta Corp. Global markets will remain under radar as Trump will assume office on January 20. Investors will also react to China’s gloomy exports data, which fell 7.7% in 2016.European Central Bank’s policy meeting on Thursday and back home Goods and Services Tax (GST) Council meeting on Tuesday will also be under focus.


>>> Nifty Hourly Chart <<<

>>> Click the chart to see on full screen <<<

Daily Candle tested 61.8% and 100 DMA, drifted and formed a Bearish Hanging man. Must wait and watch next week move.

>>> Nifty Hourly Chart <<<

>>> Click the chart to see on full screen <<<

Last leg of rally was quite large and it took exactly 2 weeks to complete from Monday, 02nd Januaury to Friday 13th Januaury 2017.

>>> Bank Nifty Daily Chart <<<

>>> Click the chart to see on full screen <<<

Again a Hanging man at 50% retrace, so wait for next to confirm.

>>> Bank Nifty Hourly Chart <<<

>>> Click the chart to see on full screen <<<

Hourly chart suggest a completion of 1-5 upmove and a break below the channel may trigger a meaningful correction any time.

>>> Hindalco - Hourly Chart <<<


>>> Performance till 13th Jan, 2017 <<<

>>> Click the image to see on full screen <<<

Above performance is not a Promise or guarantee for the given Profits or Loss.Performance given based on 1 lot at a time and clients Profit differ as per the margin availability and Number of Lots taken by them. We may or may not re-enter the Calls given here hit Stop Loss, as per market movement. The charts given above are just for educational purpose only and we don't recommend any Entry / Buy or Exit / Sell. Reader must taken their own decision or consult their qualified Analyst before making any decision

Thursday, January 12, 2017

8435-8440 May Resist.

Dear All,

>>> Nifty Daily Chart <<<

>>>Click the chart to see on full screen <<<

On Daily Chart - Price tested an important retrace resistance @ 61.8% today.

>>> Nifty Hourly Chart <<<

>>>Click the chart to see on full screen <<<

As discussed earlier - Price moving as "abcde" on hourly for its last leg of rally. May resist near 8435-40.

Wednesday, January 11, 2017

Next Resistance @ 8435-8440

Dear All,

>>> Nifty Hourly Chart <<<

>>> Click the chart to see on full screen <<<

Price made a gap up opening above 8320 and continue to move above. Next Resistance @ 8435-40 Level.

Tuesday, January 10, 2017

Above 8290-95 - May Test Next Resistance @ 8320

Dear All,

>>> Nifty 5 Mins Chart <<<

>>> click the chart to see on full screen <<<

It was a break down earlier - along with RSI - Failed and Hit SL for our Short. Now - If Price Manage to move above 8290-95 or 8320 - More rally possible. We don't have any position right now. Will decide as per movement.

Monday, January 09, 2017

Choppy Trade must - make or Break 8210 or 8280.

Dear All,

>>> Nifty Hourly Chart <<<

>>> Click the chart to see on full screen <<<

Choppy Trade must break 8210 or move above 8280.

Saturday, January 07, 2017

Weekly Review - 09th Jan, 2014

Dear All,


Nifty tested its crucial hurdle at 8,300 in Friday’s session, but couldn’t hold on to it due to profit taking at higher levels. The expert believes the recovery in banking and finance majors along with other heavyweights has raised hopes of further up-move ahead. However, he suggests keeping an extra caution in stock selection as a decent rebound from the bottom has already happened.

Important events of the week :-

Manufacturing activities contracted for the first time in a year, as PMI slipped to 49.6 points in December, down from 52.3 in November. This also marked the biggest month-on-month decline in the index in eight years or since November 2008 when the global economy had slipped into a severe downturn after the Lehman collapse. 
An impasse over the division of administrative turf between the Centre and states, higher compensation due to demonetisation and definition of coastal states persisted at GST Council meet, indicating that a roll-out of the new indirect tax regime is difficult not only from April 1, but also from July 1, 2017. The next meeting will now be held on January 16. 
Shares of information technology (IT) companies came under pressure this week after two US Congressmen reintroduced a bill to curb the use of H-1B visas, on which the Indian IT sector is particularly dependent.
Minutes from the Fed's December meeting showed policymakers were unsure about the potential impact of President-elect Donald Trump's policies on the economy. They noted upside risk to growth forecasts and suggested aggressive path of rate increase if inflationary pressures rise. 

MARKET NEXT WEEK :-

The earnings season for the third quarter will start from next week with companies such as 8kMiles, IndusInd Bank, BajajCorp, Infosys and MCX kicking off the inninigs. Investors will react to Central Statistics Office’s projection of Gross domestic product (GDP) growth data released yesterday, which pegged economic growth at an optimistic 7.1% in 2016-17, lower than 7.6% in the previous financial year. Strong US nonfarm payroll data, out yesterday, will also be a key market trigger. Investors will also await industrial production, manufacturing output and inflation data scheduled to be released on Thursday.

>>> Nifty Daily Chart - Is this a Valid Head & Shoulder <<< 

>>> Click the chart to see on full screen <<<

Is this a Valid Head & Shoudler given above ?? If Yes - You know what to do. Nothing more to say.

>>> Nifty Daily Chart <<<

>>> Click the chart to see on full screen <<<

Price tested 38.2% retrace or trend line as shown above - raises concern.

>>> Nifty Hourly Chart <<<

>>> Click the chart to see on full screen <<<

RSI singals first Bear sign. Price must break below 8210 may give way for next 8150 & 8100.

>>> Bank Nifty Daily Chart <<<

>>> Click the chart to see on full screen <<<

Again Bank Nifty on an Important Juncture. Tested 18315 or 23.6%, If cross above may trigger another 400+ Points rally.

>>> Bank Nifty Hourly <<<

>>> Click the chart to see on full screen <<<

Cross above 18315 may test next Resistance @ 18500.


>>> Asian Paints - Profit Booked Rs.12000/- <<<

>>> Click the chart to see on full screen <<<

Booked Rs.12000/- Profit on Asian Paints.

>>> CoalIndia - Profit Booked Rs.13600/- <<<

>>> Click the chart to see on full screen <<<

Made 8 Points or Rs.13600/- Profit.

>>> Divis Lab - Exited with Loss Rs.3000/- <<<

>>> Click the chart to see on full screen <<<

Exited with Loss of Rs.3000/-

>>> Performance till 06th Jan, 2017 <<<

>>> Click the image to see on full screen <<<

Above performance is not a Promise or guarantee for the given Profits or Loss.Performance given based on 1 lot at a time and clients Profit differ as per the margin availability and Number of Lots taken by them. We may or may not re-enter the Calls given here hit Stop Loss, as per market movement. The charts given above are just for educational purpose only and we don't recommend any Entry / Buy or Exit / Sell. Reader must taken their own decision or consult their qualified Analyst before making any decision

Thursday, January 05, 2017

Key Resistance @ 8280 & 8320

Dear All,

>>> Nifty 5 Mins Chart <<<

>>> Click the chart to see on full screen <<<

Price moved as 1-5 and last wave 5 have almost retraced 127.2% of wave 1-3. Now 8280 act as a key resistance - if crosses may test 8320 on the upper side.

>>> Nifty 5 Mins chart <<<


>>> Click the chart to see on full screen <<<

Last leg of wave - elaborated here - ABCDE - Today's gap Up opening and followed by Price resisted at channel top or near 8280 should be considered. Cross abvoe 8280 may test 8320. Else a Possible Correction may start any time. Let's wait for the weekend trade. Cheers!!!

Wednesday, January 04, 2017

Support @ 8180 & Resistance @ 8220 & 8250

Dear All,

>>> Nifty 5 Mins Chart <<<

>>> Click the chart to see on full screen <<<

Price moving inside a small range of 8180 to 8220 since last 2 days. Above chart suggest, if 8180 breaks correction may resume. Else Price may re-test channel top. Key Resistance may be 8220 & 8250 on the upperside.

Tuesday, January 03, 2017

Support @ 8180 & 8150

Dear All,

>>> Nifty 15 Mins Chart <<<

>>> Click the chart to see on full screen <<<<

Price forming an diagonal on top of the channel - Must hold 8180 and 8150.

>>> Divis-Lab - SL hit & Exit - Loss Booked <<<

>>> Click the chart to see on full screen <<<<

Exited below 790 and Booked Loss.

>>> COALINDIA - Daily Chart - We are Long <<<

>>> Click the chart to see on full screen <<<<

We are Long. Price given a break out and if holds - may continue to rally. Cheers!!!

Monday, January 02, 2017

Key Resistance @ 8180 - 8200 - 8230

Dear All,

>>> Nifty 15 Mins Chart <<<

>>> Click the chart to see on full screen <<<

Price moving inside the channel as 1-5 may find its resistance near 8180 - 8200 - 8230.

>>> Asian Paints - Posted 29th Dec, 2016 <<<

>>> Click the chart to see on full screen <<<

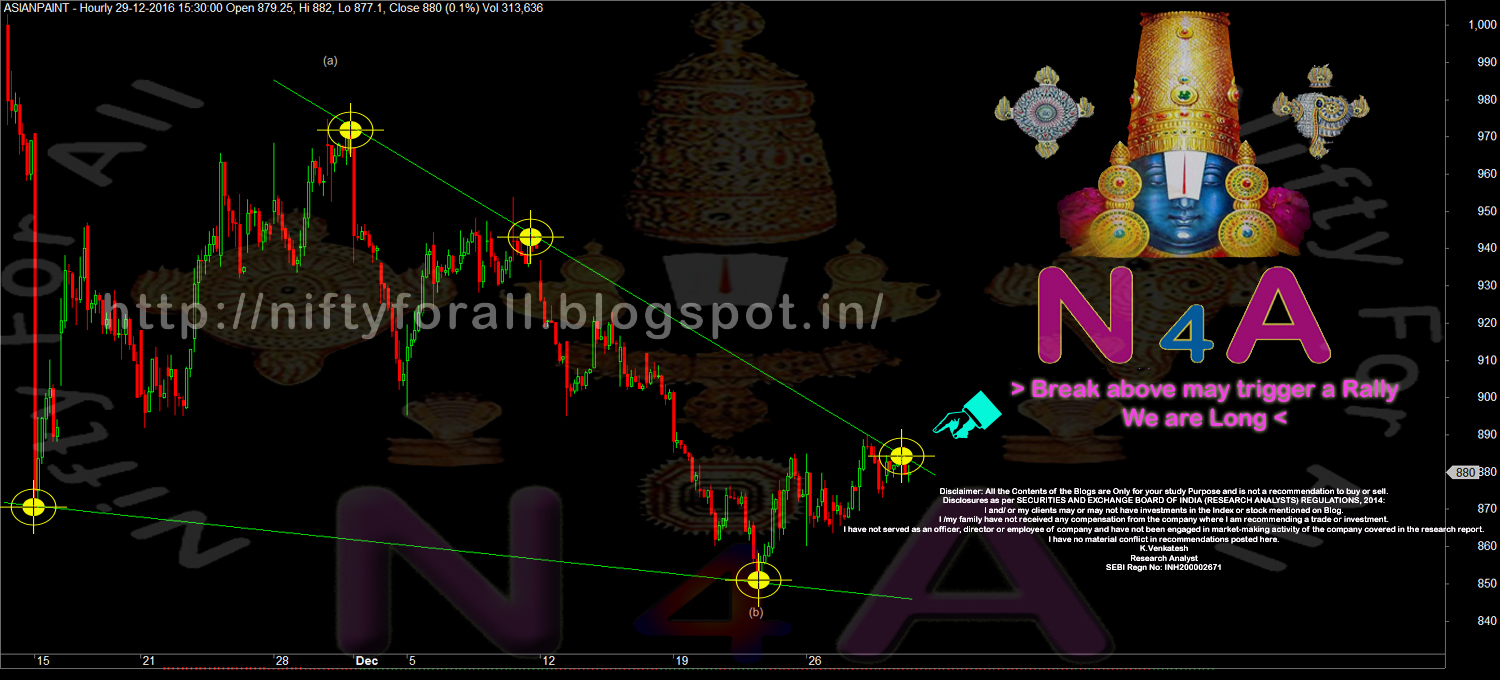
Posted on 29th Dec, 2016 - Asian Paints may rally and we are long too.

>>> Asian Paints - Profit Booked today Rs.12000/- <<<

>>> Click the chart to see on full screen <<<

Booked today Rs.12000/- More rally possible if cross above the channel as shown above.

>>> Divis-Lab - 15 Mins Chart - We are Long <<<

>>> Click the chart to see on full screen <<<

We are Long and looking for a rally till channel top as shown on above chart. Cheers!!!