Pages

Saturday, December 08, 2012

Weekly Review - 10.12.2012

Dear All,

>>>Weekly - Nifty <<<
>Click the chart to see on full screen<

Weekly Chart of Nifty Shows the Resistance as Previous high 5944.

If able to cross the Resistance then it should touch the Upper Channel as shown on Chart - Possibly 6030 Next Week.

On 28th November,2012 wrote in the Blog as "Crouching Bull Hidden Bear" See the Below link for details
http://niftyforall.blogspot.in/2012/11/crouching-bull-hidden-bear.html
as 600 Point Rally as it was a Bullish Flag Pattern as below

>Click the chart to see on full screen<

So far we had almost 223 Points Rally from 5727 to 5950. So whats Next ???

>>>Daily Nifty <<<

>Click the chart to see on full screen<

Nifty - Daily Chart suggest 5940 as Resistance and 5815 as a Support for Next Week. Cross above 5940 may give another 90 Points Rally till 6030.

>>> Hourly - Nifty <<<

>Click the chart to see on full screen<

Above given is a Hourly Nifty Chart. I have given two Possibilities as below

>>> Nifty may test 5815 if the 4th sub wave shall be divided as a-b-c-d-e.

>>> Nifty may continue as 5th sub wave if the support 5880 or 5860 holds.

Lets see.


>>>Bank Nifty <<<

Written on 29th Nov, in "Its a Warning to Bear" about Bank Nifty, Else click the Below Linke to see it http://niftyforall.blogspot.in/2012/11/its-warning-to-bear.html as chart given below

>Click the chart to see on full screen<

As Mentioned Triangle break should give a 1000 Point Rally, means almost after break out has ran up 500 points so far. So whats next.

>Click the chart to see on full screen<

Now Bank Nifty facing resistance near 12470-80 and 12800. Support at 11475.

>>> BANK STOCKS <<<


It should be agreed that Bank Stocks played major role in this rally like SBI, ICICI and Axis Bank. Lets see how its going to be on next week.

As Govt had successfully passed the FDI in Retail both in Lokh sabha and Rajya Sabha, Govt now keen to pass the Insurance and Pension bill in Parliament.

Also there is a huge expectation that RBI may slash the Interest rate in coming week, which may increase the Positive sentiment in the market.

So above all are very important for market as well as the Bank Sector in Particular. So lets see some major Blue chip Bank stocks this week


>>>SBIN<<<
>Click the chart to see on full screen<

State Bank Of India - Weekly Chart shows a triangle Pattern. 2340 act as a Stiff Resistance. Break above shall give a Big Bull Rally. Fail to break the Resistance Line may test 1950 approx.

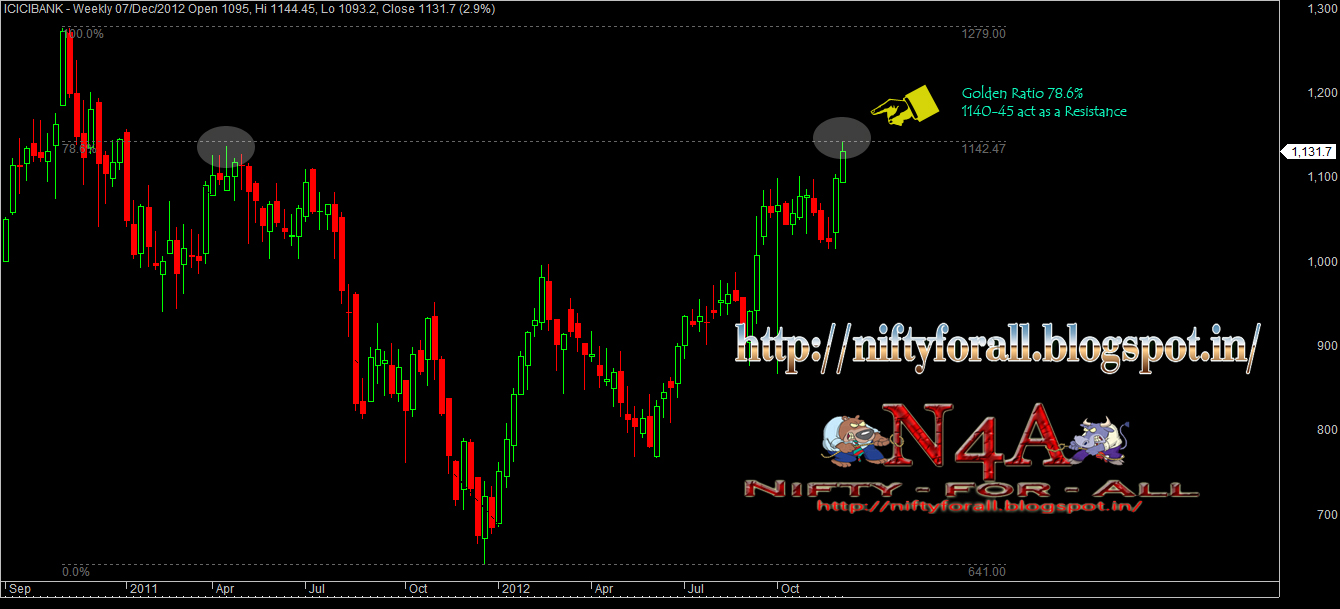
>>> ICICI BANK <<<
>Click the chart to see on full screen<

Again the Weekly Chart of ICICI Bank shows the Price was resisted on a 78.6% Golden Ratio. 1140-45 act as a Stiff Resistance.


>>>AXIS BANK <<<
>Click the chart to see on full screen<

Axis Weekly Chart shows a Resistance as Previous High 1367, cross above may test the golden ratio 78.6% or 1432.

Lets See!!! Cheers!!!

Thursday, December 06, 2012

Bottoming Tail !!!

Dear All,

>Click the chart to see on full screen<

Yet another Bullish day, Nifty closed above the channel and candle stick suggest a Bottoming Tail as shown on chart.

Sellers tried to pull down the index failed and later closed above the opening suggest Bulls are still energetic and run more in days to come.

Earlier in my blog I have suggested that since this is a Extension wave many short sellers may get trapped, like it happened today.

Lets see..

Wednesday, December 05, 2012

FDI Vs NIFTY !!!!

Dear All,

>>>NIFTY<<<

>>Click the chart to see on full screen<<

Nifty crossed 5890 Resistance and trying to move above the expanding Channel shows that the Upmove may continue.

On Going debate on Parliament on FDI Retail should really Impact the Nifty Movement tomorrow.

Resistance 5938,5990 Should be watched. Support 5855-50.

>>RPOWER<<

>>Click the chart to see on full screen<<

Rpower forming a Bullish Pole Flag Pattern, Break out confirm above the channel line as given on chart. Support at 96 and 92.

>>>IFCI<<<

>>Click the chart to see on full screen<<

IFCI - Stock testing the Neck line for the Second time, If unable to Cross, a big fall not ruled out.

EW suggest Caution ahead. Lets See.!!! Cheers!!!

Tuesday, December 04, 2012

Bears Vs Bulls ???

Dear All,

>>click the chart to see on full screen<<

Nifty Chart looks like an Expanding Triangle, break above the upper channel may favour bulls.

Resis 5890 and 5930-40.

Negative Divergence on chart suggest a Possible fall for 4th sub wave fall.

Political Chaos in Parliament may give a volatile sessions in coming days.

Monday, December 03, 2012

Relax Mr. Bull.

Dear All,

>click the chart to see on full screen<

Yes its a Pause for Bull. Unable to hold 5890 shows that Bulls may Pause the Upmove for a while. 5816 and 5765 Support can be tested soon.

Else can move up if breaks above 5890 again to test 5943 Resistance.


Saturday, December 01, 2012

Weekly Review - 03.12.2012

Dear All.

>>> NIFTY <<<


Nifty on Break out Spree, Moving on 5th wave as said last week. Now 5940-45 should Resist before next upmove. Cross above 5940-45 may test 6035-40 next week.


>>> BANK NIFTY <<<


Bank Nifty as said last week - broke the Triangle Pattern and now moving for the 5th wave.

Resistance 12175-80, 12500 and 12825.


>>>PERFORMANCE<<<


Performance for the month ended Nov 30th as given above. Those who are Interested can contact on 9677924975 or krish_venkatesh@yahoo.com

Thursday, November 29, 2012

Its a Warning to Bear.

Dear All,

>>> NIFTY <<<

>>Click the Chart to see on full screen<<

Nifty Confirmed the Start of 5th Wave broken all previous highs and Bulls have warned the Bears for next upmove.

Ongoing 5th wave seems to be extension waves, and it shows that not easy for bears to break the uptrend as I feel many traders may get trapped in Shorts.

As I wrote on Yesterdays Post "Crouching Bull Hidden Bear" about the possible 600 Point rally, Please refer the Yesterday's Post for more details.

Let enjoy the upmove..

>>> BANK NIFTY <<<

>>Click the Chart to see on full screen<<

Seems like a Triangle Break out on Bank Nifty - 1000 Point rally ahead from 11700 give a Target of 12700 soon.

Wednesday, November 28, 2012

Crouching Bull Hidden Bear

Dear All,

>Click the chart to see on full screen<


Pattern seems like a Bullish Flag, and a Break above the channel as shown on chart shall confirm the break out.

Once Break out done may give a 600 Points Rally from 5740 which is exactly the height of the Pole.

Since Price able to move and close above 20dsma and 50dsma on Friday signaled a Positive move in coming days too.

Lets see!!! Cheers!!!

Monday, November 26, 2012

Nifty on IHS ???

Dear All,

>>Click the Chart to see on full screen<<

Looks like an Inverted Head and Shoulder on given above 5 mins Chart. If breaks the below channel line, fall may continue, else Up move should continue.

Lets See!!! Cheers!!!

Sunday, November 25, 2012

Weekly Review:- 26.11.2012

Dear All,

>>>NIFTY<<<

>Click the chart to see on full screen<

5593 took Support on Friday, Shows that an upmove still pending. Possible upmove shall be as shown on chart, Resistance 5652, 5668 and 5688.

Support remains as 5588 and below this trend may change bearish.

Resistance remains as 5688 or 5693 and above this trend may change bullish.

>>>SBIN<<<

Last week SBIN was given as below ..

>Click the chart to see on full screen<

What happened as follows :-

>Click the chart to see on full screen<

As per Last week Call, State Bank of India Touched 2057 low and bounced to touch then neck line break down 2114 as shown on Chart. The pattern remains intact as far as Price moves above the trend line with volume. Else should touch our target 1975 to 1950 as mentioned last week. Those who have taken position as per our previous week update shall hold it for the target.

>>>PANTALOON<<<

Last week Pantaloon given as below

>Click the chart to see on full screen<

What Happened as follows :-

>Click the chart to see on full screen<

As said previous week, Pantaloon touched a low of 175 last week from 186 and bounced back to touch the neck line break down to 192 and again resumed its fall.

Parliamentary move about FDI Policy has made the stock volatile, but still the Target 165-166 remains intact in coming week.

>>>>UNITECH<<<<

>Click the chart to see on full screen<

Stock seems to be topped out at 27.35 and made a Bearish Dark Cloud Candle Stock on Hourly Chart Indicates that Interim uptrend has ended. If Stock able to break and sustains below 26 then 24.50 is visible soon.

>>>PERFORMANCE<<<


>Click the image to see on full screen<


Thursday, November 22, 2012

Now CAT on the WALL

Dear All,

>>NIFTY<<
>Click the Chart to see on Full screen<

Yes, it seems like a Cat on the Wall again. Though second resistance 5636 also reached today, unable to cross and hold doubts the benefit to Bear.

Tomorrow if unable to cross again 5636 and if breaks below 5603 support can invite sell off.

If crosses 5636 with volume can move to 5663 on the upper side.

>>BANK NIFTY<<

>Click the Chart to see on Full screen<

Again Bank Nifty's Several attempt to cross 11542 did not succeed today, if unable to cross may invite sell off with more volatile.

Above 11542 may move to 11620.

Wednesday, November 21, 2012

Still to Move ?

Dear All,

>>>NIFTY<<<
>Click the Chart to see on Full Screen<

Just Remember my Monday Post, Mentioned three Resistance needed to be Crossed. 5603, 5636 and 5663. Today crosses first Resistance 5603, Yet to cross 5636 and 5663.

Lot of Global Confusions and domestic Political Chaos - lead to Heavy Volatile and Tension inside Market.

But Chart and Levels never changes. As per EW if we are on 4th wave Corrective Upmove Nifty should Retrace atleast 50% or 5663 before next fall.

>>>BANK NIFTY<<<
>Click the Chart to see on Full Screen<

Bank Nifty too had a Break out On Chart. Lets see.

>>>APOLLO TYRES<<<

>Click the Chart to see on Full Screen<

Apollo Tyre - Seems like a Break Out. Have completed Wave 3 and should move up for a Corrective 4th wave. Short Term Target should be around 85 and 87.

Cheers!!!

Tuesday, November 20, 2012

Yet to Raise

Dear All,
>>>NIFTY<<<
>Click the Chart to see on full screen<

As wrote on Yesterday Post, Nifty touched near first Resistance 5600 and came down and touched Support 5550 (low was 5548) and managed to close at 5571.

If this is a a-b-c corrective upmove for sub wave 4, then should test the second resistance also. Resistance for tomorrow on 5600, 5615 and 5636. Support remains the same at 5550.

>>> BANK NIFTY <<<

>Click the Chart to see on full screen<

Bank Nifty still Holding the Support line suggest a Possible Bounce back still on Card.

>>>ADANI ENT<<<

>Click the Chart to see on full screen<

Adani Ent - If I'm now wrong, stock should keep moving to new high from here. Support 218 on closing basis. Target New High.
Lets See. Cheers!!!

Monday, November 19, 2012

Relief Rally or Sell on Raise ???

Dear All,

>>>NIFTY<<<
> Click the Chart to see on full screen <

It seems a Relief Rally possible above 5580, 5603, 5636 and 5663. Support 5550.

>>> BANK NIFTY <<<

> Click the Chart to see on full screen <

Support held as on Trend Line. If breaks the may come down to fill the gap. Else may rise.

Saturday, November 17, 2012

Weekly Review - 19.11.2012


Lord Ayyappa, the son of Lord Shiva and Mohini (Lord Vishnu), symbolizes constructive destruction which is a combination of Vishnu (Creation) and Shiva (Destruction). He is considered the protector of the weak. He saves mankind from sickness, diseases, and miseries of the world and endows them with Jnana (knowledge) leading to spiritual liberation or Moksha.


Since he represents both creation and destruction, Ayyappa is Harihara Sutha and he helps his devotee to destroy all low negative tendencies and maintains the pure Sattwic nature in the seeker. He protects our spiritual wealth and power by maintaining the thought of Godliness and destroys all other thoughts pertaining to the worldly infatuations.


All along the ascent to the shrine, the devotee tries to maintain the one thought of the Lord. When such single-pointed concentration and meditation is maintained the Truth reveals itself to the seeker, which is symbolized by the Darshan of the Lord in the temple.


Dear All,

>>>NIFTY<<<


>Click the chart to see on full screen<

Last week was really a Bad day for me, as all my Stop Loss Hit. Also the Performance sheet sink into Negative figures.

So Now the counts also changed. Please verify the chart for details.

It seems like a 3rd Wave Extension and 4(c) corrective wave is going on.

Below 5526 Nifty can test its Next support 5448 to fill the Gap left.

If I am Not wrong, Nifty Wont break 5448 and should move up to new high like 5950 or even more.

Blog Readers who have took positions on Nifty as per my earlier charts should do the needful as per adjusted levels.

>>>BANK NIFTY<<<

>Click the chart to see on full screen<

Bank Nifty still on safe zone, as far as 11260 holds - as marked with red line on chart. If breaks shall touch 11100. Break below 11100 may fall another 200 Points as marked on chart.

11480 act as a Resistance, Break above shall continue to upmove.

>>SBIN<<

As Given Last Week below

>Click the chart to see on full screen<

Earlier Last Week I gave State Bank of India Chart that it may Reverse from 2138-40, instead the expectation went wrong and it broken its Crucial support line and confirmed the interim down trend.

>Click the chart to see on full screen<

As the Support Line got Broken, now its visible that A-B-C may get a little bit deeper to touch 1975 to 1950 for C wave corrective down.

>Click the chart to see on full screen<

Also above 15 Mins Chart shows a Possible Head and Shoulder Break down. AS per that shall fall upto 150 Points to touch 1975 or near.

>>> PANTALOON RETAIL <<<


Next Week is very Important for Retails Sectors like Pantaloon as there is a Discussion or even a No-Confidence Motion in the Winter Session of Parliament on November 22nd. Left, BJP and Mamtha getting ready to Oppose the FDI in Retail as DMK kept silence on the issue, increases the Heart beat. Market never likes suspense in Political Instability and so ???

So what does the Chart Says ??


>Click the chart to see on full screen<

Again a Same Case of Clear Head and Shoulder Broken down. If I am not wrong a clear fall of 22 to 25 Point down is awaiting on chart. Target shall be 165-166.

>> PERFORMANCE <<

>Click the image to see on full screen<

Cheers!!!

Thursday, November 15, 2012

5580 Support - Will it Hold ???

Dear All,

>Click the charts to see it on full screen<

Its more difficult to trade when Price forming a complicated A-B-C Patterns. When Nifty crossed above 5720 06th and 07th November, it seems like a Break out and 4th wave have been completed. Situation reverse when again Price came below 5710 and showed like a double zig zag.

Today 5624 which is 78.6% retrace of Previous wave also broken on Intraday and closed at 5628 showed to us that 5580 is the last support before us. If broken then it may try to fill the gap left at 5420 as showed on chart.

>>BANK NIFTY<<

>Click the charts to see it on full screen<

Bank Nifty looks like a Triangle Pattern. Break out on either side may decide the trend.

Lets See. Cheers!!!

Tuesday, November 13, 2012

Happy Diwali

Dear All,

Wishing All my Friends a Happy and Profitable Diwali.

May you live your life like the festival of Diwali, happy healthy and wealthy.

A Very Very Happy Diwali!!

- NIFTY FOR ALL -


>>>NIFTY<<<

>Click the chart to see on full Screen<

Even though Nifty trading below 5680 on Intraday Basis, so far able to close above 5680. Yesterdays Hourly chart as above seems like a Break out. If able to cross 5730 and 5755 - a fast upmove possible.

5680 and 5650 remains as a Support and break below these levels may see heavy sell off.

>>BANK NIFTY<<

>Click the chart to see on full Screen<

Bank Nifty took its Support near 11427. Yesterday's Close above 11600 seems like a Break out and if it holds, then Possible upmove above recent high not ruled out.

Lets See!! Cheers!!!