Pages

Thursday, August 15, 2013

5720 Crossed. Next Resistance 5790 & 5860

Dear All,

>>>Click the chart to see on full screen<<<


5720 Crossed on Wednesday shows that the rally should continue more. Also break out on Bank Nifty along with many beaten down Bank stocks must help nifty to reach the next two levels.

>>> Bank Nifty <<<

>>>Click the chart to see on full screen<<<

Bank Nifty even tough break out, 100 HMA along with 23.6% resistance should be crossed for a good upmove. So lets wait and see.

Tuesday, August 13, 2013

Resis 5703,5720 & 5740

Dear All,


>>>Click the chart to see on full screen<<<


As wrote yesterday Nifty on a-b-c corrective upmove. Today's rally was expected as given yesterday. So lets wait and See.

>>> Bank Nifty <<<

>>>Click the chart to see on full screen<<<


Yes Bank Nifty is a Break out. See details on chart

>>> INFY <<<


>>>Click the chart to see on full screen<<<


Yes its a Loss on INFY. Trade Failed. If any taken Position on the basis on my previous analysis on Infy chart, Please Exit.

Monday, August 12, 2013

Resistance 5630 & 5720

Dear All,

>>> Click the chart to see on full screen <<<


Hope the corrective upmove to continue till 5720 or near. Lets See.

>>> Hexaware <<<


>>> Click the chart to see on full screen <<<


Hexaware Resistance 126. Lets wait and see.

Friday, August 09, 2013

Weekly Review - 12.08.2013

Dear All,


The rupee slumped to a new life time low of Rs 61.81 during the week on dollar demand from importers and weakness in equities. It may be recalled that the RBI had recently initiated measures to stem the fall in the rupee.

Speculative activities in the forex market should be curbed and short-term measures are needed to take corrective action to arrest the fall in the rupee, which hit an all-time low today, Prime Minister's Economic Advisory Council (PMEAC) Chairman C Rangarajan said on Wednesday.

Raghuram Rajan, Chief Economic Advisor in the Ministry of Finance, who on Wednesday was appointed as the next RBI Governor, said: "The government will take some more measures to stabilise the rupee soon."

The rupee ended at Rs 60.88 to the dollar on Thursday.

Meanwhile, the central bank late Thursday decided to drain out more liquidity from the money market to make the carry cost of rupee expensive.

The central bank will auction Rs 22,000 of government cash management bills every Monday, it said in a statement, without specifying for how many weeks the sales would last. The duration of cash management bill sale will be announced one day before the auction, it said.

So what are the reason behind Rupee's fall :-

Worsening current account deficit:-

High Current Account Deficit (CAD) is the main reason that has continuously impeded all efforts of government in arrest the fall of rupee. India posted a record current account deficit of 4.8 percent of gross domestic product (GDP) in the year ending March. Government’s failure to explore new destinations has led to poor growth of exports. In the absence of a single window clearance system and process delays, exports have failed to register good growth. Even traditional export areas have failed to show resilience making Indian produce globally less competitive.

Insufficient FDI inflows :-

Despite all the decisions to allow major reforms in India, the government has failed to tap major FDI inflow in the country. Instead, India has witnessed withdrawal of major projects by global giants like ArcelorMittal and Posco. Posco pulled out of its Rs 30,000 crore steel plant project in Karnataka followed by ArcelorMittal that scrapped its $12 billion (Rs 50,000 crore) steel plant project which it was planning to set up in Odisha. Inordinate delays, land acquisition problems, government clearance delays, lack of promptness have all contributed to the withdrawal of major companies. Last year Indian companies spent more overseas than Foreign Investors in India.

FII outflows :-

Overseas investors have pulled out nearly Rs 18,500 crore (about USD 3 billion) from the Indian capital markets in July. In their highest monthly outflow, overseas investors pulled out a record Rs 44,162 crore (over USD 7.5 billion) in the month of June. Outflows of FIIs have put a continuous pressure on rupee not allowing it to come out of the slump. Meanwhile, leading global bank Goldman Sachs has downgraded Indian stocks to underweight and recommended investors to stay selective on concerns of economic growth recovery.

Rising Import bill:-

Rising import bill (arising out of gold) is also a major factor that has curtailed government’s effort to tackle the fall of rupee. Gold contributes to over 10 percent of the total import bill. Gold imports were 141 tonnes in April and rose to 162 tonnes in May. Due to certain government measures gold imports declined significantly in June but could not be held for the month of July.

Overall economic contraction :-

Poor economic growth in the manufacturing, agricultural and mining sector has dented investor sentiment and they have become wary of investing in India. Reflecting a persistent slowdown, industrial production in May contracted by 1.6 percent, lowest in the past 11 months. Last week RBI cut its growth forecast to 5.5 percent for the fiscal year, from 5.7 percent. Unless a better sentiment prevails, confidence in the rupee will stay shattered.

Strengthening of dollar overseas :-

In the last six months US dollar index strengthened by 3.52 percent. The strengthening of dollar is beyond government’s control which is ultimately hammering the Indian currency. Gradual recovery in US economy coupled with rising expectations that Federal Reserve will withdraw its stimulus package soon is underpinning the US dollar index.

Some good news to NRI because of Falling Rupee :-

While all this may spell doom for most, it is sweet music to the NRIs as a weakening rupee and dollar earnings is the best recipe to invest. It is certainly an opportune time to repay rupee debts (read education loans) but would it make sense to invest?

Real estate has already caught the fancy of many NRIs and with regulation in place, will make long term investments fruitful. Yet due to the liquidity issues, it may not be a preferred investment option for all. At the same time, banks are offering attractive rates for NRI deposits, which being tax free prove to be a good hedge for both inflation and to a certain extent the falling rupee.

So lets move on to Charts :-

>>> Nifty Weekly <<<


>>>Click the chart to see on full screen<<<


Nifty Weekly chart showing a strong signal from Bears. If breaks below 100wma & 200wma then free fall to continue.

>>> Nifty - Daily <<<


>>>Click the chart to see on full screen<<<


Though the support line broken nifty may give a possible relief rally or corrective upmove next week. Possible bounce back may last longer till the previous broken support line as shown on chart.


>>>Click the chart to see on full screen<<<


5486-87 acting as a support and hence it saved last week. But a deadly cross of 50dma and 200 dma gives a big warning from bear. Hence High Caution is advised.

>>> Nifty - Hourly <<<


>>>Click the chart to see on full screen<<<


Yes 5575 & 5620 act as a resistance. Till a meaningful upmove or break out on chart, remain with Sell on Rise Strategy.

>>> Bank Nifty - Weekly <<<


>>>Click the chart to see on full screen<<<


Weekly Chart of Bank Nifty gives a clear picture of where its moving towards. My view on Bank nifty to remain with a Target near 8000. Mean while an interim support may give a relief to Bank nifty which should once again be used for sell on rise.

>>> Infy <<<

>>>Click the chart to see on full screen<<<


INFY topped out. Unless breaks above 3030 or 3045 I expect a good correction. Probably it may fill the gap left as shown on chart. Cheers!!!

>>> Performance <<<


>>>Click the image to see on full screen <<<

Wednesday, August 07, 2013

Nifty on its way !!!

Dear All,


>Click the chart to see on full screen<


Nifty on its way, may retrace for sw(ii) as shown on chart before next fall.


>>> Adani Power <<<
>>>As Updated on 05th Aug, 2013<<<


>Click the chart to see on full screen<


>>> Happened <<<


>Click the chart to see on full screen<


As expected Break Out on Chart. Hope more upside. Lets See. Cheers!!!

Tuesday, August 06, 2013

No Sign of Relief

Dear All,

>>> Click the chart to see on full screen <<


Unlike I expected for last 2 days, Nifty did not move up. Instead fell down after breaking the important support 5620 and confirmed the downside. More details on chart.

Monday, August 05, 2013

More Relief Rally Possible !!!

Dear All,

>> Click the chart to see on full screen <<

Nifty forming an Irregular Flat, and if breaks above the channel should move nifty till 5760 or 5800. If fail to break above 5690 may continue to fall on the downside. Lets See

>>> Federal Bank <<<

>> Click the chart to see on full screen <<


>>> Adani Power <<<

>> Click the chart to see on full screen <<

Saturday, August 03, 2013

Weekly Review - 05.08.2013

Dear All,

Nifty Daily - As Updated Last Week.

>Click the chart to see on full screen <

As Given last week Nifty broken the support and started falling down. Lets see whats next ???
>>>> Nifty - Daily - What's Next <<<

>Click the chart to see on full screen <

Nifty near the Trend support line at 5620-5630, if breaks then possible downside upto 5573 and 5431.
>>> Nifty - Houry <<<

>Click the chart to see on full screen <

Above hourly chart suggest end of wave 4 and started wave 5 on the downside. 5620-30 should support, else may test next level 5573 or near.

>>> Bank Nifty <<<

>Click the chart to see on full screen <


Bank Nifty closed near the golden ratio of 61.8% looks very important next week. If holds then possible bounce back, else may fall to next level 78.6% or 8975 as shown on chart.

>>> Block buster Chart for the Week <<<

>>> IB Real Est <<<

>Click the chart to see on full screen <


>>> Exide Industries <<<

>Click the chart to see on full screen <


>>> Cipla <<<

>Click the chart to see on full screen <


>>> Performance <<<

>>> for the month ended July, 2013 <<


>Click the chart to see on full screen <

Thursday, August 01, 2013

Volatile, Still can move Up

Dear All,


>>click the chart to see on full screen<


So I still believe one more upmove as per attached chart. More details on chart. Cheers!!!

Wednesday, July 31, 2013

Resistance 5753, 5800 & 5840

Dear All,


>>>Click the chart to see on full screen<<<

After gap down opening, wave 3 ended and started moving up for wave 4. Relief rally on its way.
>>> Bank India <<<

>>>Click the chart to see on full screen<<<


Bank India >> above 187 should target for 200+ as given on Chart. Cheers!!!

Tuesday, July 30, 2013

Relief Rally Possible ?!?!?

Dear All,


>Click the chart to see on full screen <

5750 is an important support if holds then wave 3 should end here and should bounce back for wave 4. Seems like a Possible H&S formation. So I think its time to cover shorts and wait for next opportunity to short at higher level. Lets See.

Monday, July 29, 2013

Support 5830 & 5768

Dear All,


>Click the chart to see on full screen<


5830 immediate support if fails, then should test 5768. RBI Policy meet should move the market tomorrow. Lets See.

>>> IB REAL EST <<< >>> As Updated on Last Weekly Review <<<
>Click the chart to see on full screen<

>>> Happened <<<
>Click the chart to see on full screen<

Well 20,000 is the Profit so far in IBREALEST. Cheers!!!

Saturday, July 27, 2013

Weekly Review - 28.07.2013

Dear All,

When RBI after market hours on 23rd July announced that the total quantum of funds available under liquidity adjustment facility (LAF)has been capped to 0.5% (lowered from 1%) of individual bank’s net deposits and time liabilities (NDTL), which would be effective from July 24, 2013, which triggered the sell-off on Wednesday Morning, particularly Bank Stocks in particular.

RBI also increased the requirement of minimum daily cash reserve ratio (CRR) maintenance to 99% from 70%, which would be effective from first day of fortnight beginning July 27, 2013.

So RBI gave a clear signal that it worried Only about Rupee depreciation and not about growth factors.

Apart from domestic Issued looming fear over slowdown in China coupled with caution ahead of Reserve Bank of India and US Federal Reserve’s policy meeting next week.

Reserve Bank of India’s monetary policy on Tuesday will be a key trigger for markets in terms of any cue on liquidity measures to support rupee.

Meanwhile US Federal Reserve will unveil its policy decision on Wednesday with investors awaiting clarity on tapering of the stimulus.

Crisil slashes GDP forecast to 5.5% on rupee weakness,Montek Singh Ahluwalia Said while Growth may dip to 5% for rest of 12th plan. Surely these messages are not good for Market.

So lets go to Technicals...

>>> Nifty - Daily <<<
>>> As given on Last Weekly Review - 22nd July, 2013
>Click the chart to see on full screen<

Above chart Published last week and said every one that Wave B ended and C should start any time. Advised caution.

>>>Happened and Yet to<<<


>Click the chart to see on full screen<

So Nifty made 6093 and started sliding for wave C, Hit a low of 5869.

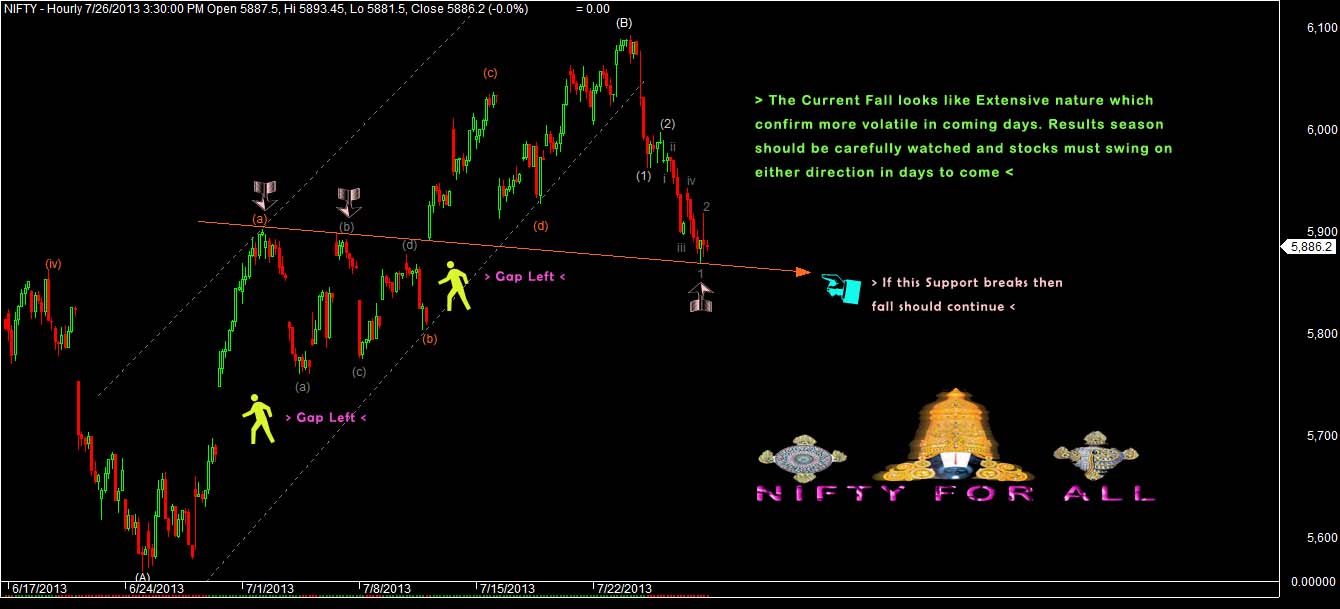
>>>> Nifty - Hourly <<<

>Click the chart to see on full screen<

Above chart is Hourly and marked with lot of extension wave signals us that heavy volatile is getting ready to hurt us. Indeed if the support line as shown on chart gets broken Price should move downward to fill the gap left.
>>> Bank Nifty <<<

>>> As given on Last Weekly Review - 22nd July, 2013 <<<

>Click the chart to see on full screen<


>>> Happened and Yet to <<<
>Click the chart to see on full screen<

Bank Nifty - Have advised caution last week and Bank stocks in particular. As expected Wednesday sell off in bank nifty and Bank stocks Hammered down heavily.

>>> Block Bluster Charts and Performance Last Week <<<

>>> Jp Associates <<<
>>> As Published on 22nd July, 2013

>Click the chart to see on full screen<

>>> Happened <<<

>Click the chart to see on full screen<


>>> Bata India <<<
>>> As Published on 23rd July, 2013 <<<

>Click the chart to see on full screen<


>>> Happened<<<

>Click the chart to see on full screen<


>>> Ambuja Cement <<<


>Click the chart to see on full screen<


>>> Tata Power <<<

>Click the chart to see on full screen<


>>> IBRealEst <<<
>Click the chart to see on full screen<


>>> Performance <<<

>Click the image to see on full screen<