Pages

Thursday, February 13, 2014

5970 Support

Dear All,

Govt may not meet fiscal deficit target of 4.8%: UN Report:-


Ahead of interim Budget, a United Nations report on said the government is unlikely to meet fiscal deficit target of 4.8 per cent of the GDP in the current fiscal due to low growth and high subsidy.

"Given the weak growth momentum in the region and the difficulties in raising tax revenues and curbing expenditure growth, fiscal deficits will remain substantial in the near term," the report titled 'World Economic Situation and Prospects 2014' said.

"In India, the government is unlikely to meet its target of reducing the deficit to 4.8 per cent of GDP in the current fiscal year 2013-14 since growth is below projections and the depreciation of the rupee pushes up the subsidy bill," it said.
The government of India had budgeted to bring down fiscal deficit to 4.8 per cent of GDP in the current financial year, from 4.9 per cent in 2012-13. The interim Budget for 2014-15 is scheduled to be presented in Parliament on February 17.

>>> NIFTY <<<

>>> Click the chart to see on full screen <<<

Nifty down again. If the count i have marked on chart is not wrong, i feel nifty may take support at 6000 or 5970 for wave b and to move up for wave c to complete 4th sub wave corrective upmove. If 5970 get breaks then fall may continue. Friday should give the answer. Lets See.

>>> Bank Nifty <<<

>>> Click the chart to see on full screen <<<

Bank Nifty too halted at 61.8%, if unable to hold 10400 or 78.6% retrace then fall should continue.


>>> Apollo Tyre <<<

>>> Click the chart to see on full screen <<<

First Target done with a Profit of 10,000. Broken all support shows more fall yet to come. Lets See

Wednesday, February 12, 2014

6131 Resistance

Dear All,

Will DOW see another 1929 Crash Again :-


Yes the current chart of Dow along with 1929 looks similar. The chart superimposes the market’s recent performance on top of a plot of its gyrations in 1928 and 1929.

Dow over the last two months has continued to more or less closely follow the 1928-29 pattern outlined in that two-months-ago chart. If this correlation continues, the market faces a particularly rough period later this month and in early March.

>>> NIfty - As Updated on 05th Feb, 2014 <<<

>>> Click the chart to see on full screen <<<

We have a Buy call on Nifty from 6005 onwards. See what happened.

>>> Happened and Yet to <<<<

>>> Click the chart to see on full screen <<<

100 hma resisted. Nifty done 2nd Target. Now if 100hma able to hold and cross above may test 6131 resistance.

>>> Bank Nifty - As Updated on 05th Feb, 2014 <<<

>>> Click the chart to see on full screen <<<

Bank Nifty Crossed our Key Resistance 10321. We are long from 10,000 and 10200 onwards.

>>> Happened and Yet to <<<

>>> Click the chart to see on full screen <<<

Bank Nifty crossed 10321. If able to cross 100hma then more upside left. Minor break also seen on chart.

>>> CESC - As Updated Yesterday <<<

>>> Click the chart to see on full screen <<<

CESC wrote Yesterday about the possible fall - as it broken the Head and Shoulder. See what Happened.

>>> Happened and Yet to <<<
>>> Click the chart to see on full screen <<<

Yes, Good fall as expected. Made a Profit of 20,000. Expect more fall also.

Tuesday, February 11, 2014

Choppiness Continues

Dear All,


Federal Reserve Chairwoman Janet Yellen will be pressed on Tuesday about whether the weaker-than-expected job growth will throw a wrench in the central bank’s tapering plans.

Indian markets today also witnessed a very range bound trading as the market lagged triggers. Today Jennet Yellen (Newly appointed US Fed chairman) will deliver her first view on the monetary policy. It is a known fact that the Indian markets along with its Asian peers are highly dependent on the FII inflow. And her view would provide a good amount of clarity on whether the flow would continue or would reduce going ahead. As a result there was no one who wanted to take a bold step ahead of her spec, ultimately keeping the global markets range bound.

Now the important factor is what to expect from her when she delivers her speech. She has always been considered as pro liquidity and hence one can expect the similar tone today also. Rather even the data on the unemployment front is suggesting that she may ease off the tightening monetary conditions. In the past Two monetary policies Ben Bernanke has cut the bond buying by USD 10 billion each time to take it to the USD 65 billion per month. We expect Yellen to put some breaks on the cut in bond buying and ease some liquidity position. However these are only expectations and the US Fed Chairperson always come out with something surprising every time.

Yellen will chair her first policy-making committee meeting on March 18-19. If the Fed continued to see data suggesting slow growth “there would have to be serious discussion” about whether to change its policy stance

Lets See..

>>> NIFTY <<<

>>> Click the chart to see on full screen <<<

As Usual Choppy Trading again. It seems like updating the same chart for last 2 days. May be Nifty too waiting for Yellens Speech. So lets wait and see.

>>> CESC <<<

>>> Click the chart to see on full screen <<<

Yes we are Short from 446, made a low of 436. Head and Shoulder break down may trigger more fall. Lets See.

Monday, February 10, 2014

Directionless Trade

Dear All,

>>> Click the chart to see on full screen <<<

Directionless Trade. Need to wait and Watch.

Sunday, February 09, 2014

Weekly Review :- 10.01.2014

Dear All,


Mobius Says Emerging-Market Selloff to Deepen on Outflows

The worst isn’t over for emerging markets after the benchmark stock index sank to a five-month low and the nations’ currencies tumbled, said Templeton Emerging Markets Group’s Mark Mobius.

"We are looking but actually not buying at this stage. Prices can come down or take time to stabilise." The outlook from Mobius, a consistent advocate of emerging markets who's been investing in the countries for more than 40 years, contrasts with that of Jim O'Neill , who created the BRIC moniker for the four largest developing economies and said this week that the rout created a buying opportunity.

The MSCI Frontier Markets Index rose 21 per cent in 2013, outpacing the MSCI Emerging Markets Index by 26 percentage points, the widest annual gap since 2005. Corporate earnings in the 26 countries that make up the frontier index have risen to the highest level in five years.

Profits in the MSCI emerging index, which is dominated by the BRIC countries, are still about 11 per cent below their 2011 high. The pace of economic growth in China is among the biggest questions in developing nations and the largest risks for markets, Bill Gross, who oversees the world's biggest bond fund at Pacific Investment Management Co., said Feb. 4.

Riskier assets remain vulnerable, he said. The US-domiciled Templeton Frontier Markets Fund has topped 98 per cent of its peers in the last three years with a 4.6 per cent annualized return, according to data compiled by Bloomberg. The fund, which managed about $1.5 billion of assets at the end of December, had its biggest holdings in Middle East and Africa, according to a fact sheet on the firm's website.

Templeton's $13 billion Asian Growth Fund has outperformed 89 per cent of peers in the past five years. Mobius said in a Januray 29 interview that inflows into developing nations would resume later this year because they have fast economic growth, low debt relative to gross domestic product and high foreign-exchange reserves. "There are opportunities," Mobius said. "But there's no rush to get in."

>>> Nifty - As Updated Last Weekly Review <<<

>>> Click the chart to see on full screen <<<

>>> Happened and Yet to <<<

>>> Click the chart to see on full screen <<<
As wrote last weekly review, Nifty breached 5970 and took support @ 5933. Key resistance 6130 or 6144, break above these levels may change the pattern and above counts are modifiable. Lets See.

>>> Nifty - Hourly Chart - As Updated as on 05th Feb, 2013 <<<

>>> Click the chart to see on full screen <<<

>>> Happened and Yet to <<<

>>> Click the chart to see on full screen <<<
We are long sine 6005 and moved above 6034 and closed @ 6064.

>>> Bank Nifty <<<

>>> Click the chart to see on full screen <<<
Bank nifty if crosses the middle line - expect short covering.

>>> Axis Bank - As Updated on 04th Feb 2014 <<<

>>> Click the chart to see on full screen <<<
>>> Happened and Yet to <<<

>>> Click the chart to see on full screen <<<
We are still Long and yet there is a fresh break out see on friday.

>>>> SBI - As Updated on 04th Feb 2014 <<<
>>> Click the chart to see on full screen <<<
>>> Happened and Yet to <<<

>>> Click the chart to see on full screen <<<
Again a fresh break out see on SBI on friday. Lets see.

Thursday, February 06, 2014

Volatile Again. Bull Safe Still

Dear All,

>>> Click the chart to see on full screen <<<

Amid heavy volatile Nifty able to sustain above 6000 level. Price holding above 6034 shows bulls on control. Now if able to cross 50 Hour moving average 6046 then upmove should be good. Fresh break out on RSI also add strength to the bull view.

>>> Bank Nifty <<<

>>> Click the chart to see on full screen <<<

Comments on Chart.

>>> JSW Steel <<<

>>> Click the chart to see on full screen <<<

JSW Steel hit sl. May re-enter also.. Lets See.

Wednesday, February 05, 2014

Resistance @ 6131 & 6144

Dear All,

>>> Click the chart to see on full screen <<<

Hold Your Longs.. Upmove should continue.

>>> Bank Nifty <<<

>>> Click the chart to see on full screen <<<

Bank Nifty should move above the channel. Hold Longs.

Tuesday, February 04, 2014

Bulls are Back Again ???

Dear All,


India is better prepared to deal with any further US Fed tapering, but the country needs to remain vigilant to face eventualities, Reserve Bank Governor Raghuram Rajan said here today.

"We have done a lot to make the economy robust and we are better prepared (to deal with impact of tapering). (But) I will never say we are fully prepared for any eventuality. We have to be vigilant.

"We are better prepared certainly now than we were six months ago and that is because of hard work by the government as well as regulators," Rajan told reporters after the FSDC meeting.

The meeting took place against the backdrop of tapering of Quantitative Easing (QE) in the US, and the Reserve Bank revising the current financial year's growth projection to less than 5 per cent.

Last week, the US Federal Reserve decided to cut its bond purchases further by another $10 billion. It has decided to purchase $65 billion per month of mortgage backed securities and longer-term treasury securities as against $75 billion per month earlier.

>>> Nifty <<<

>>> Click the chart to see on full screen <<<


If you are a regular reader - You must be well know that we are advising short for many many days on nifty. Yes today told to cover shorts and enter Long. More details on chart.

>>> Bank Nifty - As Udpated Last Weekly Review <<<

>>> Click the chart to see on full screen <<<

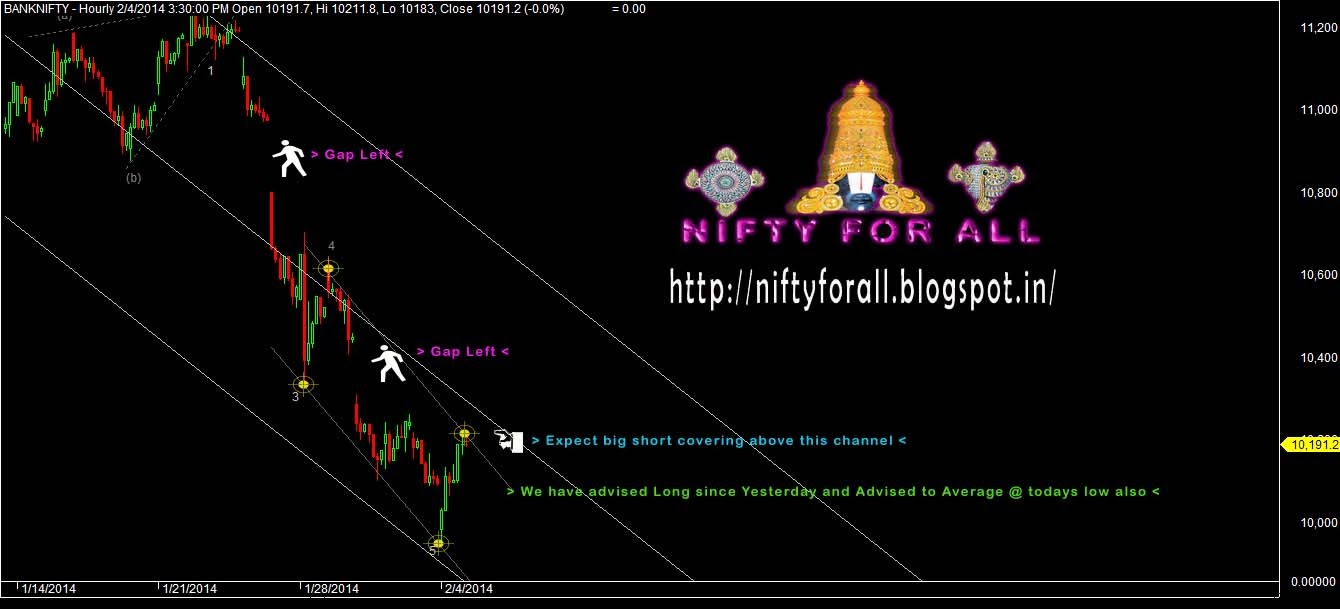
Wrote on Last weekly review that its time to cover shorts as we witnessed a much positive divergence. See what happened today !!!

>>> Happened and Yet to <<<

>>> Click the chart to see on full screen <<<


Yes We are Long since yesterday and average around today's low also. So as per chart if breaks the channel - expect a big short covering.

>>> Axis Bank <<<

>>> Click the chart to see on full screen <<<


Yes We are Long in Axis Bank since 1105. Got a Clear break out as on chart. Big upmove coming. Lets See.

>>> State Bank of India <<<

>>> Click the chart to see on full screen <<<


SBI gave a clear break Out on Chart. Yes we are long in SBI too since 1510. Lets See.

Monday, February 03, 2014

6005 Broken - Next 5960

Dear All,

>>> Nifty - As Updated Last weekly Review <<<

>>> Click the chart to see on full screen <<<

Wrote last week about the possible downside for nifty.

>>> Happened and Yet to <<<

>>> Click the chart to see on full screen <<<

Yes 6005 done. Lets wait for Next Target.

>>> Apollo - As Updated on 28th Jan 2014 <

>>> Click the chart to see on full screen <<<

Have initiated Sell on Apollo Hosp on 28th Jan.

>>> Happened <<<

>>> Click the chart to see on full screen <<<

Stop Loss hit with a loss of Rs.5500

Saturday, February 01, 2014

Weekly Review 03.02.2014

Dear All,


India revises down 2012/13 GDP growth to 4.5 percent y/y :-

India revised down its economic growth for the fiscal year 2012/13 to 4.5 percent from 5.0 percent earlier, the government data showed on Friday, on lower than provisionally estimated output in farm and manufacturing sectors.

The latest numbers are the first revised gross domestic product (GDP) estimates for the last fiscal year.

The data also showed lower than estimated growth numbers for exports, capital investment and consumption sectors, suggesting deeper underlying weaknesses in Asia's third-largest economy, which grew at more than 9 percent before the 2008 global financial crisis.


The GDP growth for 2011/12 fiscal year was, however, upwardly revised to 6.7 percent from 6.2 percent, but that of the 2010/11 year was revised down to 8.9 percent from 9.3 percent, the data from the Ministry of Statistics showed.

The latest downward revision was proof that efforts to revive investments by fast-tracking the approvals for big infrastructure projects didn't quite help revive the sentiments last fiscal. Aggregate demand in the economy stayed subdued and growth in all its components – government, private consumption and investments – trailed the previous year's data.

>>> Nifty - As Updated Last Weekly Review <<<

>>> Click the chart to see on full screen <<<

Last week mentioned about the end of wave 2 and wrote about the possibilities of fall below the channel with caution.

>>> Happened and yet to <<<

>>> Click the chart to see on full screen <<<

As expected Nifty down the channel and took support @ 6030. Below 6030 may see 5970.


>>> Nifty - Hourly - As Updated Last Weekly Review <<<

>>> Click the chart to see on full screen <<<

On hourly front said about the importance of channel support. See what happened !!!

>>> Happened and yet to <<<

>>> Click the chart to see on full screen <<<

Broken the channel and broken down 6140 crucial support also. Now I expect more fall with the given target on chart. Sell on rise is a good tactics.

>>> Bank Nifty - As Updated Last Weekly Review <<<

>>> Click the chart to see on full screen <<<

Last week wrote about the failure of Bank nifty to cross the Channel bottom of Pitch fork.

>>> Happened and yet to <<<
>>> Click the chart to see on full screen <<<

Bank Nifty too fell down as expected. Lets see what's next on hourly chart.

>>> Bank Nifty - Hourly Chart <<<
>>> Click the chart to see on full screen <<<

Hourly chart showing a positive divergence - Possible bounce back on card. So again Sell on rise is advisable. Short sellers may use the fall to cover shorts now and sell on rise.

>>> Hits of the Week <<<

>>> Andhra Bank <<<

>>> Click the chart to see on full screen <<<

>>> Century Tex <<<

>>> Click the chart to see on full screen <<<

>>> LT <<<
>>> Click the chart to see on full screen <<<

>>> JP Associates <<<

>>> Click the chart to see on full screen <<<

>>>Performance<<<

>>> Click the image to see on full screen <<<

above performance does not include nifty profit. for details of subscription send email to niftyforall@yahoo.com