Pages

Saturday, May 16, 2015

Weekly Review 18.05.2015

Dear All,

>>> We are on WhatsUp also <<<

>>> Click the image to see on full screen <<<

Please send Message Only on Whatsup as per format given.

>>> Nifty Weekly Chart <<<

>>> Click the chart to see on full screen <<<

This entire week was full of volatile and ofcourse price managed to hold above 50wma and gave a green colored doji also. Looks like bulls are holding with strong foot till last week and looking for a recovery soon.

>>> Nifty Daily Chart <<<

>>> Click the chart to see on full screen <<<

Daily Chart gave us a confused signal as shown on above chart. Hence we need some confirmation for either side movement.

>>> Nifty Hourly Chart <<<

>>> Click the chart to see on full screen <<<

Looks like a bottom formation, after completing a Bullish Wolf Wave on Hourly chart. But, still we need confirmations like IHS Break out, MA's cross over etc., Lets wait for it.

>>> Bank Nifty Weekly Chart <<<

>>> Click the chart to see on full screen <<<

50 Week Moving Average on Hold. Hanging Man shows a possible break out from the falling wedge any time.

>>> Bank Nifty Daily Chart <<<

>>> Click the chart to see on full screen <<<

Price above 18110. Next Resistance 18645.

>>> ADANIENT <<<

>>> Click the chart to see on full screen <<<

We shorted at 705 again. Price made a Low of 670 with almost a Profit of Rs. 17500 only.

>>> ORIENTBANK <<<

>>> Click the chart to see on full screen <<<

We are long since 194 and we made some partial profit @ 204 with a Profit of Rs.20K. Next Target near 230.

>>> ASIANPAINT <<<

>>> Click the chart to see on full screen <<<

We are short from 800. Waiting for a good fall from here.

>>> Performance till 15th May, 2015 <<<

>>> Click the chart to see on full screen <<<

Kindly send email to niftyforall@yahoo.com for details of our services.

Thursday, May 14, 2015

Is it a Triangle - Means 8320 Must Cross.

Dear All,

>>> Nifty Hourly Chart <<<

>>> Click the chart to see on full screen <<<

If this is a Triangle or a IHS - Must break above 8320 for a healthy rally.

>>> ORIENTBANK <<<

>>> Click the chart to see on full screen <<<

We are long since 194. Looking for 230 Target on Screen to Book a Profit 36,000/- Cheers!!!

Wednesday, May 13, 2015

Resistance @ 8260,8300 & 8320

Dear All,

>>> Nifty Hourly Chart <<<

>>> Click the chart to see on full screen <<<

We are Long still. As per above chart, if the Price break the channel. No doubt, Rally to start.

>>> Bank Nifty Hourly <<<

>>> Click the chart to see on full screen <<<

Price above 18110, Next Resistance 18645. We are long since 17600. Cheers!!!

Tuesday, May 12, 2015

Support @ 8125 & 8068

Dear All,

>>> Nifty Hourly Chart <<<

>>> Click the chart to see on full screen <<<

If this chart is not wrong, then Inverted Head & Shoulder will give a big push for bulls Rally. 8125 and 8068 must hold to give life for this pattern.

>>> ADANIENT <<<

>>> Click the chart to see on full screen <<<

We sold @ 705 Yesterday and Price made a low of 670 today. Break Below 670 may test 660 and 650. Cheers!!!

Monday, May 11, 2015

Resistance 8320 & 8420

Dear All,

>>> Nifty Hourly - Posted on Weekly Review <<<

>>> Click the chart to see on full screen <<<

Mentioned 50 HMA as an important resistance to gain more strength.

>>> Nifty Hourly - Happened <<<

>>> Click the chart to see on full screen <<<

Price above 50 & 100 HMA. RSI on a Clear Break out. Price if trades above 8320, Next move till 8420.


>>> Bank Nifty - Posted on Weekly Review <<<

>>> Click the chart to see on full screen <<<

Mentioned clearly that Bank Nifty may bounce from here, as the Fall gets completed as w-x-y. See what happened.

>>> Bank Nifty - Happened <<<

>>> Click the chart to see on full screen <<<

Price made a break through above 18110 and hold long for a next move till 18645. Cheers!!!

Saturday, May 09, 2015

Weekly Review - 11.05.2015

Dear All,


The finance ministry on Friday said the income tax department wouldn’t adopt coercive methods for recovery of minimum alternate tax (MAT) dues from foreign investors. “Field officers will not push for any coercive demand on MAT claims right now,” said a ministry official.

Expressing concerns over Foreign Portfolio Investors facing MAT demand, global rating agency Fitch today said the controversy may prompt FPIs to think twice before investing in India.

Despite a strong pullback staged by the markets on Friday, experts are not convinced that the stocks can sustain the gains. They believe that unless the Nifty closes closes above 8350, going long may not be advisable.

FIIs have been exiting Indian financial markets, fretting over government's Minimum Alternate Tax demands on them, and also in search of better returns as Indian companies report dismal earnings growth in fourth quarter ended March 31.

According to a report, an avalanche of IPOs in China is pulling down Indian stocks. Money managers in Singapore, Hong Kong and London are withdrawing money from Dalal Street to bet on Chinese companies as the regulator there ..

>>> Nifty Weekly Chart - As Posted Last Weekly Review <<<

>>> Click the chart to see on full screen <<<

Last Week - Wrote clearly how the 50 Week Moving Average looks important. See what happened.

>>> Nifty Weekly Chart - Happened <<<

>>> Click the chart to see on full screen <<<

Doji, with price holding above 50 Week Moving Average shows some rays of hope for the Bulls. If the Price continues to hold above the channel next week also, then expect some pull back rally.

>>> Nifty Daily Chart - As Posted Last Weekly Review <<<

>>> Click the chart to see on full screen <<<

Wrote on Last Weekly Review - That Nifty will test 8000 for the last leg of downside. See what happened.

>>> Nifty Daily Chart - Happened <<<

>>> Click the chart to see on full screen <<<

Above chart is an excellent example of an Complete Irregular Correction or a Bullish Wolf Wave. Since the price had broken the channel as expected and test 8000, we covered all our Shorts and taken long for a good UPmove.

>>> Nifty Hourly Chart <<<

>>> Click the chart to see on full screen <<<

A clear Positive Divergence on RSI shows how the Bulls are hidden and emerged out. So far we are in a 100 to 120 Points Profit. If 50 HEMA crosses and holds above it, no doubt bulls may march upward with more strength.

>>> Bank Nifty Daily Chart <<<

>>> Click the chart to see on full screen <<<

Bank Nifty corrected almost 61.8% of the previous rise, Hence if this was a 4th sub wave, Price may start moving up from here onwards.

>>> Bank Nifty Hourly Chart <<<

>>> Click the chart to see on full screen <<<

Bank Nifty so far corrected as W-X-Y. If this analysis is not wrong , hope for a recovery next week.

>>> ADANIENT - As Posted on 05th May, 2015 <<<

>>> Click the chart to see on full screen <<<

We recommended AdaniEnt to Sell on 05th May, 2015. See what happened.

>>> ADANIENT - Happened <<<

>>> Click the chart to see on full screen <<<

Price made a low of 633. We had a Approx Profit of Rs.30,000/-. Resistance 690 & 705 - unable to cross may trigger another sell off Soon.

>>> SRTRANSFIN - As Posted on 05th May, 2015 <<<

>>> Click the chart to see on full screen <<<

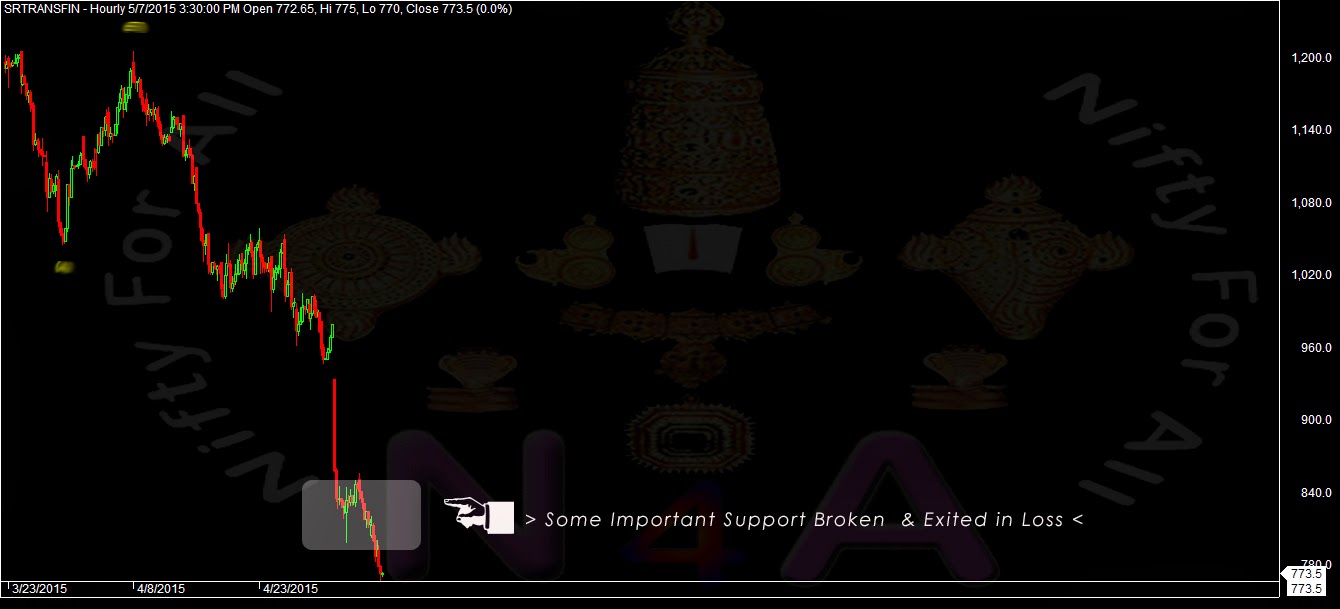
We recommended Srtransfin to Buy on 05th May, 2015. See what Happened.

>>> SRTRANSFIN - Happened <<<

>>> Click the chart to see on full screen <<<

We Exited in Loss, as it broken some major support.

>>> ITC <<<

>>> Click the chart to see on full screen <<<

We are long in ITC and we recommend to Buy the stock on every dips. Expect a good rally from here.

Thursday, May 07, 2015

Are You ready to Buy !!!!

Dear All,

>>> Nifty Daily - As Posted on Last Weekly Review <<<

>>> Click the chart to see on full screen <<<
Wrote on Last Weekly Review - Nifty may touch 8000 for the last wave down, may break the channel also. See what happened.

>>> Nifty Hourly Chart - Happened <<<

>>> Click the chart to see on full screen <<<
As expected, Price broken the channel and touched 8000. It looks like A-B-C got completed as shown on chart. If this analysis is not wrong, Expect a bounce from here.

>>> SRTRANSFIN - As Posted on 05th May, 2015 <<<

>>> Click the chart to see on full screen <<<
Wrote on 05th May to Buy the Stocks as there are lot of accumulation seen.

>>> SRTRANSFIN - Happened <<<

>>> Click the chart to see on full screen <<<
Broken our support and Exited with Loss. Call closed.

>>> ADANIENT - As Posted Yesterday <<<

>>> Click the chart to see on full screen <<<Wrote to Sell. See what happened.

>>> ADANIENT - Happened <<<

>>> Click the chart to see on full screen <<<Almost 60 Pts down or Rs.30,000 Profit. Cheers!!!

Wednesday, May 06, 2015

Where is the Bottom ?!?!?!?

Dear All,

>>> Nifty Daily - Posted on Weekly Review <<<

>>> Click the chart to see on full screen <<<

Remember this Post on our Weekly Review. Wrote clearly Nifty may test 8000 or near to it, before a meaningful bounce. See what happened.
>>> Nifty Hourly Chart - Happened <<<

>>> Click the chart to see on full screen <<<

After breaking 8100, 8026 & 7950 Visible.

>>> ADANIENT - As Posted Yesterday <<<

>>> Click the chart to see on full screen <<<

We have recommended to Sell AdaniEnt on our Yesterday Post. See what happened today.

>>> ADANIENT - Happened <<<

>>> Click the chart to see on full screen <<<

We have shorted @ 697 and Price made a low of 673. Expecting more fall if RSI and Price breaks the Trend line support as shown on chart. Cheers!!!

Tuesday, May 05, 2015

Support @ 8275, 8250 & 8225

Dear All,

>>> Nifty 15 Mins Chart <<<

>>> Click the chart to see on full screen <<<

Support 8275,8250 & 8225 should hold, Else fall to continue. On the Other side, If 8362 crosses then UP move to continue till 8412,8495 & 8577.

>>> Bank Nifty Hourly Chart <<<

>>> Click the chart to see on full screen <<<

Key Resistance 18540 plays an important roll. If crosses then only a rally towards 19000 possible. Else correction may come in.

>>> ADANIENT <<<

>>> Click the chart to see on full screen <<<

Previous High - If does not breaks - Fall ahead - Caution.

>>> SRTRANSFIN <<<

>>> Click the chart to see on full screen <<<

We are Long since 830, Expecting a good rally soon. Cheers!!!

Monday, May 04, 2015

Key Resistance 8346 & 8362 - Above Rally to Continue

Dear All,

>>> Nifty Hourly Chart - As Posted on Weekly Review <<<

>>> Click the chart to see on full screen <<<

Wrote on weekly review - that the fall to continue if breaks below 8146, But nifty made a gap up today and rallied heavily, So lets see whats next. We have two alternatives left now. Lets See.

>>> Alternative - 1 <<<

>>> Click the chart to see on full screen <<<

As per first alternative, if 8362 unable to cross then, price may fall down for the last leg.

>>> Alternative -2 <<<

>>> Click the chart to see on full screen <<<

This count in valid only if 8362 crosses. Cheers!!!