Pages

Saturday, October 17, 2015

Weekly Review - 19.10.2015

Dear All,

>>> Nifty Daily Chart <<<

>>> click the chart to see on full screen <<<

Nifty closed above 8208. As we have mentioned in our earlier post, Price so far moving as A-B-C - expected to complete near 100% or 8208. But last week price managed to close above 8208 or 8230 shows price may extend towards 127.2% as shown on above chart. Hence we exited our shorts with loss. Now price need to close above 8250 for next move towards 8350-60. Lets see more details on hourly chart also.

>>> Nifty Hourly Chart <<<

>>> click the chart to see on full screen <<<

Friday price made a turn around from 8150 or the channel support as shown on above chart. Hence forth, it may be an 1-5 upmove - and may test the wedge top as shown on chart.

>>> Bank Nifty Daily Chart <<<

>>> click the chart to see on full screen <<<

Bank Nifty hourly - shows price extending on the upper side. Price need to close above 100DMA to test the channel resistance.

>>> Bank Nifty Hourly Chart <<<

>>> click the chart to see on full screen <<<

Price need to break above the wedge for next upmove.

>>> SIEMENS - Follow Up <<<

>>> click the chart to see on full screen <<<

We are still holding our shorts with (lot of) patience... Waiting for a reversal confirmation to exit our short. Above chart looks like an ending diagonal pattern, break and close above may confirm the next upmove to decide our short.

>>> LICHSGFIN - Follow Up <<<

>>> click the chart to see on full screen <<<

Yet to decide on our Shorts...

>>> M&M - Follow Up <<<

>>> click the chart to see on full screen <<<

Range bound above Support 1267..Earlier broken channel has been retested - Holding short to decide further. Cheers!!!

Thursday, October 15, 2015

Next Resistance @ 8185 & 8210

Dear All,

>>> Nifty Hourly Chart <<<

>>> Click the chart to see on full screen <<<

One more gap up opening after Fed says no more rate hike this year. World market rallied and celebrated. Price moved above 50HMA and closed. Now 8185 and 8210 key for next upmove. Lets Wait.

Wednesday, October 14, 2015

Support @ 8090 & 8055

Dear All,

>>> Nifty Hourly Chart <<<

>>> click the chart to see on full screen <<<

Price below 50 HMA. Next Support @ 8090 and 8055. Choppy Volatile till it breaks and closed below these two support levels. Till then no direction. Lets wait for it. Cheers!!!

Tuesday, October 13, 2015

Watch 50 DMA - May Support or Resist tomorrow.

Dear All,

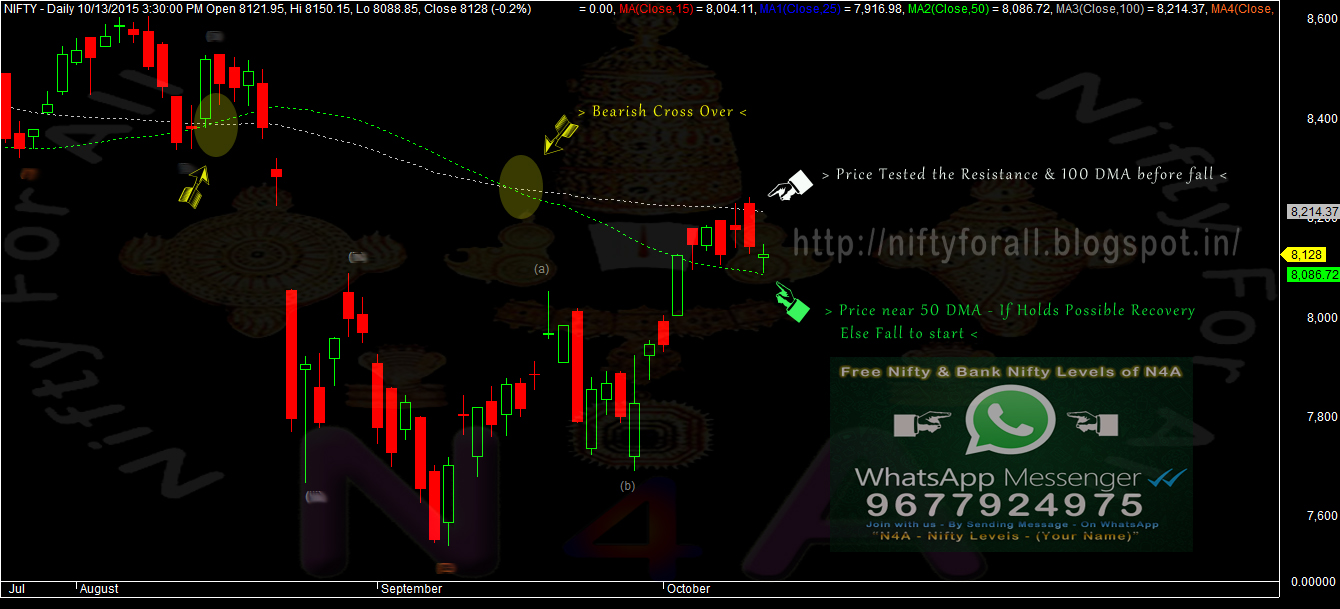
>>> Nifty Daily Chart <<<

>>> Click the chart to see on full screen <<<

Its a Tussle with 50 & 100 DMA. If 50DMA Holds, Possible recovery, If breaks Must correct.

>>> Bank Nifty Daily Chart <<<

>>> Click the chart to see on full screen <<<

Again BN also having the same tussle with 50 DMA. Struggling to find the direction. Lets wait and See. Cheers!!!

Monday, October 12, 2015

8115 Support. Though, Positive IIP Data - Still Chart Not looking Bullish.

Dear All,

>>> Nifty Hourly Chart <<<

>>> Click the chart to see on full screen <<<

Above chart - as per today's closing - Says some Bearish Out look. But Today's IIP and CPI (after market hours) may give a gap up Opening tomorrow. Many might have lost their patience - due to heavy volatile upmove for last 6 trading session and started asking about the Opposite trade also. Never mind, We go as per chart. No Judgement.
So what's the Problem ??? - Price getting extended so far, not able to give a break out till now. Indicator and counts are giving a Negative Outlook only. So far we have witnessed a lot of Volatile - still more to come. But we need a constant Proof for a change in strategy, till then remain with what it says. That's the Rule. But don't forget - Patience Pays at any Cost.
Since last 5 trading days, Price moving inside a channel (like an expanding triangle) as shown on above chart - gives a lot of possibilities. Now the Price must break and close above the Upper end of the Channel - 8260 - for a positive upmove. Lets see how the Price moves tomorrow.

>>> Bank Nifty Hourly <<<

>>> Click the chart to see on full screen <<<

RSI not moving with the Price. Even after 50 BPS rate cut from RBI - there is no positive break out on chart. So what's cooking. Only the coming result season has the answer. Many Banks are on Headlines like Bank of Baroda on 6000 Cr Money Transfer Case, IDBI on Kingfisher's 900 Crore Loan case. It looks like NPA are setting up a stage and might impact both the top line and bottom line soon for every banks. So we need some constant break out on chart - which must say to you that "ITS TIME TO BUY". I think its not happening so far. As usual - lets wait for tomorrow's move to decide. Cheers!!!

Saturday, October 10, 2015

Weekly Review - 12.10.2015

Dear All,

>>> Nifty Daily Chart <<<

>>> Click the chart to see on full screen <<<

Price almost filled the gap left above. As we mentioned last week - Price moving as A-B-C wave. Next week, any cross above 8230 may trigger a fresh rally and short covering. Provided, if filed to cross may trigger a fresh sell off. Next Week is highly crucial for both bulls and Bears.

>>> Nifty Hourly Chart <<<

>>> Click the chart to see on full screen <<<

Wave A = Wave C. Wave C almost rallied 540 Points. Next week if the upper channel is crossed, Expect a Fresh Rally. Else Bears may re-enter.

>>> Bank Nifty Daily Chart <<<

>>> Click the chart to see on full screen <<<

After 50 BPS rate cut from RBI - there is no major movement seen on bank nifty so far. Since all the banks are struggling with their NPA and Cost of funds, might have a negative effect on their balance sheet. Most of the PSU banks are still struggling at their lower price range.
As per above chart - technically price almost filled the gap left as shown on chart, now struggling to move ahead. 50 and 100 DMA - Price should cross above for a healthy rally.

>>> Bank Nifty Hourly Chart <<<

>>> Click the chart to see on full screen <<<

Hope above chart is easy to understand by its move and pattern. If the Price unable to cross above the channel top - expect to test the support at the bottom of the channel.


>>> Siemens - As Posted on Last Weekly Review <<<

>>> Click the chart to see on full screen <<<

Have posted on Last Weekly Review - about SIEMENS - Possible correction on card. See what happened.

>>> SIEMENS - Happened <<<

>>> Click the chart to see on full screen <<<

We are still holding our short and expecting a correction soon.


>>> LICHSGFIN <<<

>>> Click the chart to see on full screen <<<

Explained on above chart - how the price traveled so far - as ABC Upmove. So expect some correction if the price breaks the support. We have short position in the above mentioned stock. Lets See. Cheers!!!

Thursday, October 08, 2015

Trap or a Crap...!!!

Dear All,

>>> Nifty Hourly Chart <<<

>>> Click the chart to see on full screen <<<

Neither a Profit booking nor a Trend reversal shall be confirmed only on further movement. Though indicators on -ve div, price need to confirm the same. Lets wait for it.

>>> Bank Nifty Hourly Chart <<<

>>> Click the chart to see on full screen <<<

Price filled the gap. Like nifty - BN too had a -ve div. Though we need to wait for more confirmation on either side movement. Lets Wait and See. Cheers!!!

Wednesday, October 07, 2015

Volatile Market moving towards 8208

Dear All,

>>> Nifty Hourly Chart <<<

>>> Click the chart to see on full screen <<<

Moving towards the resistance with lot of volatile. Lets wait and Watch.

Tuesday, October 06, 2015

Resistance @ 8208-8225

Dear All,

>>> Nifty Hourly Chart <<<

>>> Click the chart to see on full screen <<<

Its a 515 Points rally as A-B-C. Hence 8208 or 8225 act as a stiff resistance. Lets wait and see.

Monday, October 05, 2015

Next Resistance @ 8208-25

Dear All,

>>> Nifty Hourly Chart <<<

>>> Click the chart to see on full screen <<<

So lets wait for the given resistance to decide. Cheers!!!

Saturday, October 03, 2015

Weekly Review - 05.10.2015

Dear All,

>>> Nifty Hourly Chart <<<

>>> Click the chart to see on full screen <<<

Above Hourly Chart - Explained with Time and Price Zone...
As per ... Key Resistance 8008-21, Cross above may trigger a Rally and Short Covering till 8208.
Unable to cross may trigger a Sell Off and Fall till Previous low 7690 or even below.

>>> Bank Nifty Hourly Chart <<<

>>> Click the chart to see on full screen <<<

Again Bank Nifty Hourly Chart - Explained with Time and Prize Zone.
Key Resistance 17430-460 - If crosses then - Rally and Short Covering till 17825.
Else - Sell off till 16550 or even below.

>>> SIEMENS - As Posted on 28th Sep, 2015 <<<

>>> Click the chart to see on full screen <<<

Posted the above chart on 28th Sep, 2015 - for a possible correction. See what happened.

>>> SIEMENS - Happened <<<

>>> Click the chart to see on full screen <<<

Stock made a low of 1250 and bounced till 1355. As per above chart, I assume that the rally might have completed as 1-5 for wave C. Hence Price may face a resistance at 1355, If so expect a correction next week. We are holding our short still.

>>> ARVIND - Posted on 22nd Sep, 2015 <<<

>>> Click the chart to see on full screen <<<

Posted on 22nd Sep, 2015 - Stock may face some correction. See what happened

>>> ARVIND - Happened <<<

>>> Click the chart to see on full screen <<<

As mentioned earlier - We are still on Short. As per above chart - If price breaks the Channel support - Expect a free fall again. Cheers!!!

>>> PERFORMANCE for the month end of 30th Sep, 2015 <<<

>>> Click the chart to see on full screen <<<

Kindly send Your request on our email id niftyforall@yahoo.com for details of our service.

Wednesday, September 30, 2015

Next Resistance @ 7984 & 8022

Dear All,

>>> Nifty Hourly Chart <<<

>>> Click the chart to see on full screen <<<
Crossed above 7930 and next resistance @ 7984 and 8022. Positive Data Like Core Sectors and Global Markets Rally may help index to open positive once again tomorrow. Lets wait and see. Cheers!!!

Tuesday, September 29, 2015

More Volatile Ahead - Caution

Dear All,

>>> Nifty Hourly Chart <<<

>>> Click the chart to see on full screen <<<

Yes we have covered the shorts today with Nifty 500 Points and Bank Nifty 800 Points.
After 50 BPS rate Cut form RBI - Price spiked and test above 7910 - Shows more volatile ahead.
As per above chart - If I am not wrong - Price may test the lower end of the channel and may try to bounce back to fill the gap left above, In such a case - Expect a complete volatile trading in coming days.

>>> YesBank - As Posted on 22nd Sep, 2015 <<<

>>> Click the chart to see on full screen <<<

Wrote Last time on Yes Bank - may test 700 any time soon. See what happened.

>>> YESBANK - Happened <<<

>>> Click the chart to see on full screen <<<

As Expected - Price almost touched 702.75 and gave us a good Profit of Rs.18250/-

>>> M&M <<<

>>> Click the chart to see on full screen <<<

Yes We have shorted M&M at 1273 and Price touched a low of 1236 - Expecting a more fall till 1190 - Lets Wait and See. Cheers!!!

Monday, September 28, 2015

Resistance 7910 & Support 7770 - RBI to decide the Trend

Dear All,

>>> Nifty Hourly Chart <<<

>>> click the chart to see on full screen <<<
7910 & 7770 - To decide. Lets have an Interesting RBI Day tomorrow. Nothing more to say.

>>> SIEMENS - Hourly Chart <<<

>>> click the chart to see on full screen <<<
We have short positions as mentioned on chart, Expecting more fall if the support breaks. Cheers!!!

Saturday, September 26, 2015

Weekly Review - 28.09.2015

Dear All,

>>> Nifty Weekly Review <<<

>>> Click the chart to see on full screen <<<


Above weekly chart - shows some warning sign. 7902 or 38.2% retrace - must act as a key resistance - if unable to cross may trigger more sell off. If 100 Week Moving Average breaks - More sell off likely - Caution.

>>> Nifty Daily Chart <<<

>>> Click the chart to see on full screen <<<

As mentioned last week - Head and Shoulder looks in favour of bear. Till price stays below the neck like - its seems like an Sell on Rise.

>>> Nifty Hourly Chart <<<


>>> Click the chart to see on full screen <<<

7910 - Should be watched. IHS on formation.

>>> Bank Nifty Hourly Chart <<<

>>> Click the chart to see on full screen <<<

17310 - Crucial to watch now. Above 17310 - IHS may come into action.

>>> BAJAJAUTO - As Posted on Last Weekly Review <<<

>>> Click the chart to see on full screen <<<

Updated as a follow up on last weekly review about Bajaj Auto - See what happened...

>>> BAJAJAUTO - Happened <<<<

>>> Click the chart to see on full screen <<<

We Booked Profit of Rs.20625/-

>>> YESBANK - As Posted on Last Weekly Review <<<

>>> Click the chart to see on full screen <<<

Posted YESBank as follow up last weekly review. See what happened

>>> YESBANK - Happened <<<

>>> Click the chart to see on full screen <<<

Low made 714 almost near to our first Target. We made a Part profit near 734 for Rs.10K.

>>> Performance - till 25th Sep, 2015 <<<


>>> Click the image to see on full screen <<<

Please send email to niftyforall@yahoo.com from details of our service

Wednesday, September 23, 2015

Watch 7910 - Trend Decider on Expiry Day !!!

Dear All,

>>> Nifty Hourly Chart <<<

>>> Click the chart to see on full screen <<<

Very Interesting day tomorrow. Expiry day also. 7910 Should be watched. Above 7910 expect upmove.

>>> ZEEL - Hourly Chart <<<

>>> Click the chart to see on full screen <<<

Made a Profit of Rs.15000/- on ZEEL Short. Expect more sell off if the resistance line - unable to cross. Cheers!!!