Pages

Tuesday, October 27, 2015

Cat on the Wall Again.

Dear All,

>>> Nifty Daily Chart <<<

>>> Click the chart to see on full screen <<<

RSI looking weak, though 100 DMA may support bulls. Cat on a Wall situation again. Needs more confirmation.

Monday, October 26, 2015

Need Confirmation - But Stay Caution

Dear All,

>>> NIFTY - Hourly <<<

>>> Click the chart to see on full screen <<<

We are again short, re-entered at higher level again. Now the price continue to hold below the support line may add some more pressure on the downside.

>>> ARVIND - Hourly <<<

>>> Click the chart to see on full screen <<<

We are Holding our short @ Arvind for quite long time. Break down today shows more weakness ahead.

>>> YESBANK - Hourly <<<

>>> Click the chart to see on full screen <<<

We are Holding our short on YESBANK too with Profit. Expecting more such fall. Cheers!!!

Saturday, October 24, 2015

Weekly Review - 26.10.2015

Dear All,

>>> Nifty Daily Chart <<<

>>> Click the chart to see on full screen <<<

Wave X Completed @ 8328-30. If this resistance holds next week, Expect the correction to start any time soon. Else rally may extend.

>>> Nifty Hourly Chart <<<

>>> Click the chart to see on full screen <<<

Above 8320-30 - Gap to be filled till 8360.

>>> Bank Nifty Hourly Chart <<<

>>> Click the chart to see on full screen <<<

Its still on a complicated corrective upmove. Let's wait for it to get completed.

>>> Stocks Updates - Note <<<

We are still Holding all our Stocks as we have posted chart for last 2 weeks, hence not updating any of it. We continue to carry Short till SL reaches its resistance (SL). So far Market rallied 300+ Points, there is not drastic movement in our stocks. We advice purely positional trades and Don't change our Strategy until there are proper proof on chart for the same.

Many are many queries about our patience and why there is no change in the strategy even after market rallied above our resistance 8208. The answer is simple - above 8208 - we have expected a move till 8320 or 8360. That doesn't change the trend, hence we remain with our earlier view only.

This week I have posted some psychological aspect of trading. Of course these are not my own, I need to post here, since i feel this is the right time to do the same.

So what is Patience and Why we need it :-


When the market is moving with high volatile and choppy trades - its usual that many traders loose their patience and force themselves to change their strategy by exiting their current position - and enter fresh trades, usual go into Loss.

Having patience is very essential for a complicated (choppy+volatile) market, in fact patience might actually be the most important factor. And you should keep in mind that trading takes time and market does not moves on your time. As a Trader you should be prepared to wait for a long period of time for a trading opportunity depending on your trading strategy. Many traders fails when they begin to create setup that are not there, thus they are forcing the market.


It usually happens because of their emotional appetite, who often blame market or others, rather than understand the nature or the market.

>>> 20 GOLDEN RULES FOR A SUCCESSFUL TRADING <<<

To become a successful trader, One must be mentally fit ... So this week we give you 20 Golden rules of a Famous Indian Analyst Acharya for your Success..

Rule No 1 : The financial market is a game to make money!It is not a puzzle to solve. The only reason why you should be in the Stock market is to make money. You can be wrong 8 times out of ten and still make money in the markets. So do not be afraid to be wrong. The ONLY GAME and GOAL here is to makemoney.

Rule No 2 : Do not pay attention to fundamentals. Stocks do not follow any fundamentals. For no rhyme or reason, strong stocks and rock solid credentials suddenly lose all their sheen and are untouchables. No one told you in October 2007 that markets were to crash in 3 months, not even in Jan 2008 – Everyone was seeing a rosy picture.

Rule No 3 : Do not blindly believe anyone. Question everything and everyone. Even me. Never blindly believe anything you read or hear about. What anyone is telling or sharing with you is just his opinion., and an opinion is someone's belief – not necessarily fact.

Rule No 4 : Price pattern is all that matters! Trust them. Patterns repeat. See how the pattern repeat and understand firsthand how the markets move. News, rumors and hot tips are useless. Otherwise you would not be getting them free.

Rule No 5 : Patterns have memory! What happened when the last time markets unfolded this pattern. Chances are very high the same action is going to repeat. Patterns repeat. And they are very predictable.

Rule No 6: Stand apart from the crowd at all times. Trade ahead, contrary or even behind the crowd. Try to be the first one in on the trade and the first out with profit in hand. Our job is take their money before they take ours. We should be swift to take advantage of the pattern being presented all the time. Remember the crowd always herds and standing apart from the crowd, always gives us a picture of where they are about to move.

Rule No 7 : Trend is always relative to time.Your job is to make sure the trade fits your clock. Price movement is always up or down and trend is always time specific. A stock or commodity could be in a long term uptrend and a short term downtrend, so take your trade to suit our time frame. Never jump time frames to justify your trade.

Rule No 8 : Avoid the OPEN! The herding tendency is the highest at open, when the whole group is reacting to the overnight news, events or announcements etc. We do not want to join the herd unless it suits our purpose. SO AVOID THE OPEN!

Rule No 9 : Assume the trade is lost even before the trade! The biggest mistakes and blunders of trading occur when you are presented with a textbook pattern, with the WILL NOT FAIL trade, where you over leverage and get wiped out. If you cannot afford to exit at stop loss then you will be out of the game. Always trade within your limits and BE READY to exit at the Stop.

Rule No 10 : If you have to search for the Impulse, it is not there. Impulses are very clear, Near vertical price movements. They just jump out of the chart and create a sense of excitement. If you need to look for the Impulse, chances are it is not there. DONT KEEP LOOKING FOR THEM!

Rule No 11 : If you cannot count it, assume the pattern is a Corrective wave! Barring the Zig Zag, it is almost impossible to count a correction as it unfolds. The only true indication we have is the numerous overlaps. Do not force a count on the correction. The count will become apparent as you reach the end of the correction.

Rule No 12 : Wait till the first pullback/correction after the first impulse for the trade. Never Buy during the correction! Once you see motive waves on both sides of the top/bottom, we know there is a trend change. Wait till the correction ends to trade, since corrections can go on for a long time. You will save precious time than waiting for the correction to end.

Rule No 13 : Manage time efficiently. Time is money in the markets. Do not block your capital waiting for the correction to end. Use time more efficiently for analyzing the markets you are trading

Rule No 14 : Never risk more than 2% of your portfolio on any trade.The first rule of trading is to stay in the game and profitable trades will eventually follow. At random there is a one in a million chance of you making 50 losing trades in a row. Never risk more than 2% of the portfolio in a trade and you will remain in the game to see profits.

Rule No 15 : Never add to a losing position! I do not need to say anything more about this. If you are losing, then accept that you made a mistake and get out of the position while you still can. Averaging a losing position can only make matters worse.

Rule No 16 : Wait for the wave to completely unfold! The highest gains are seen in the third and fifth waves. Wait for the third and fifth wave to complete before thinking of exits. The last 20% of the time gives you over 50% of the gain. Let the waves work to get profits for you.

Rule No 17 : Profit and unease are seen together when you get into a trade.The best trades are seen when you get into the trade at the beginning of the trend. However till the markets move resolutely in your anticipated direction, there is an unease. Learn to live with it. Without mental resolve, it is difficult to win the trading game.

Rule No 18 : Larger trends rarely if ever turn quickly! Investors are a very adamant and stubborn lot and resist change vehemently. Trend changes are slow to develop and wave pattern will tell you much in advance. Be patient and wait till the trend change is clear on the pattern – usually it is clear long before the crowd realizes the trend change.

Rule No 19 :Trading the markets is not everything. It's only money. There are many and more important things in life and you will be better off not forgetting that.

Rule No 20 : All rules are meant to be broken! The skill is when to know which rule to be broken and when to adhere to them.

CHEERS !!!

Wednesday, October 21, 2015

Watch for 8190-95

Dear All,

>>> Nifty Hourly Chart <<<

>>> click the chart to see on full screen <<<

Price out of the wedge. Today's late recovery might be an throw back. Price need to break below 50 Hour Moving Average to confirm the down trend, if holds, expect price to reverse once again to test the previous high or even above

>>> Nifty 5 Mins Chart <<<

>>> click the chart to see on full screen <<<

Above 5 mins chart has two alternatives. As per, if 8190-95 holds, price may rebound again. Else bear may gain strength.

>>> SIEMENS - FOLLOW UP <<<

>>> click the chart to see on full screen <<<

Siemens on our radar for many days and we are following the same continuously. So if 50 DMA breaks, price may fall like previous history. So far price has been resisted near 1391. Trend line as shown on chart has also broken. Lets wait for more confirmation. Cheers!!!

Tuesday, October 20, 2015

Support @ 8190,8140 & 8100

Dear All,

>>> Nifty 5 Mins Chart - Posted Yesterday <<<

>>> Click the chart to see on full screen <<<

Posted Yesterday - on 5 Mins Chart - Nifty travelling inside a narrow channel - Must break either side to confirm the trend. See what happened.

>>> Nifty 5 Mins Chart - Happened <<<

>>> Click the chart to see on full screen <<<

Today - First Channel as mentioned on the chart - broken down. Need to break the next channel. Though price may get strength from Supports like 8190,8140 & 8100. Results Season and flow of News from domestic and internation - may fluctuate the price with heavy volatile. Lets wait for confirmation from price to decide.

Monday, October 19, 2015

Next Resistance @ 8320 & 8360-70

Dear All,

>>> Nifty Hourly Chart <<<

>>> Click the chart to see on full screen <<<

8320 Key Resistance. Cross above 8320 may try to fill the gap left between 8360-70 level.

>>> Nifty 5 Mins Chart <<<

>>> Click the chart to see on full screen <<<

Above 5 mins chart explains how the price moved so far. Price on the top most channel must either break above or below to decide the next level of journey. Lets wait and See. Cheers!!!

Saturday, October 17, 2015

Weekly Review - 19.10.2015

Dear All,

>>> Nifty Daily Chart <<<

>>> click the chart to see on full screen <<<

Nifty closed above 8208. As we have mentioned in our earlier post, Price so far moving as A-B-C - expected to complete near 100% or 8208. But last week price managed to close above 8208 or 8230 shows price may extend towards 127.2% as shown on above chart. Hence we exited our shorts with loss. Now price need to close above 8250 for next move towards 8350-60. Lets see more details on hourly chart also.

>>> Nifty Hourly Chart <<<

>>> click the chart to see on full screen <<<

Friday price made a turn around from 8150 or the channel support as shown on above chart. Hence forth, it may be an 1-5 upmove - and may test the wedge top as shown on chart.

>>> Bank Nifty Daily Chart <<<

>>> click the chart to see on full screen <<<

Bank Nifty hourly - shows price extending on the upper side. Price need to close above 100DMA to test the channel resistance.

>>> Bank Nifty Hourly Chart <<<

>>> click the chart to see on full screen <<<

Price need to break above the wedge for next upmove.

>>> SIEMENS - Follow Up <<<

>>> click the chart to see on full screen <<<

We are still holding our shorts with (lot of) patience... Waiting for a reversal confirmation to exit our short. Above chart looks like an ending diagonal pattern, break and close above may confirm the next upmove to decide our short.

>>> LICHSGFIN - Follow Up <<<

>>> click the chart to see on full screen <<<

Yet to decide on our Shorts...

>>> M&M - Follow Up <<<

>>> click the chart to see on full screen <<<

Range bound above Support 1267..Earlier broken channel has been retested - Holding short to decide further. Cheers!!!

Thursday, October 15, 2015

Next Resistance @ 8185 & 8210

Dear All,

>>> Nifty Hourly Chart <<<

>>> Click the chart to see on full screen <<<

One more gap up opening after Fed says no more rate hike this year. World market rallied and celebrated. Price moved above 50HMA and closed. Now 8185 and 8210 key for next upmove. Lets Wait.

Wednesday, October 14, 2015

Support @ 8090 & 8055

Dear All,

>>> Nifty Hourly Chart <<<

>>> click the chart to see on full screen <<<

Price below 50 HMA. Next Support @ 8090 and 8055. Choppy Volatile till it breaks and closed below these two support levels. Till then no direction. Lets wait for it. Cheers!!!

Tuesday, October 13, 2015

Watch 50 DMA - May Support or Resist tomorrow.

Dear All,

>>> Nifty Daily Chart <<<

>>> Click the chart to see on full screen <<<

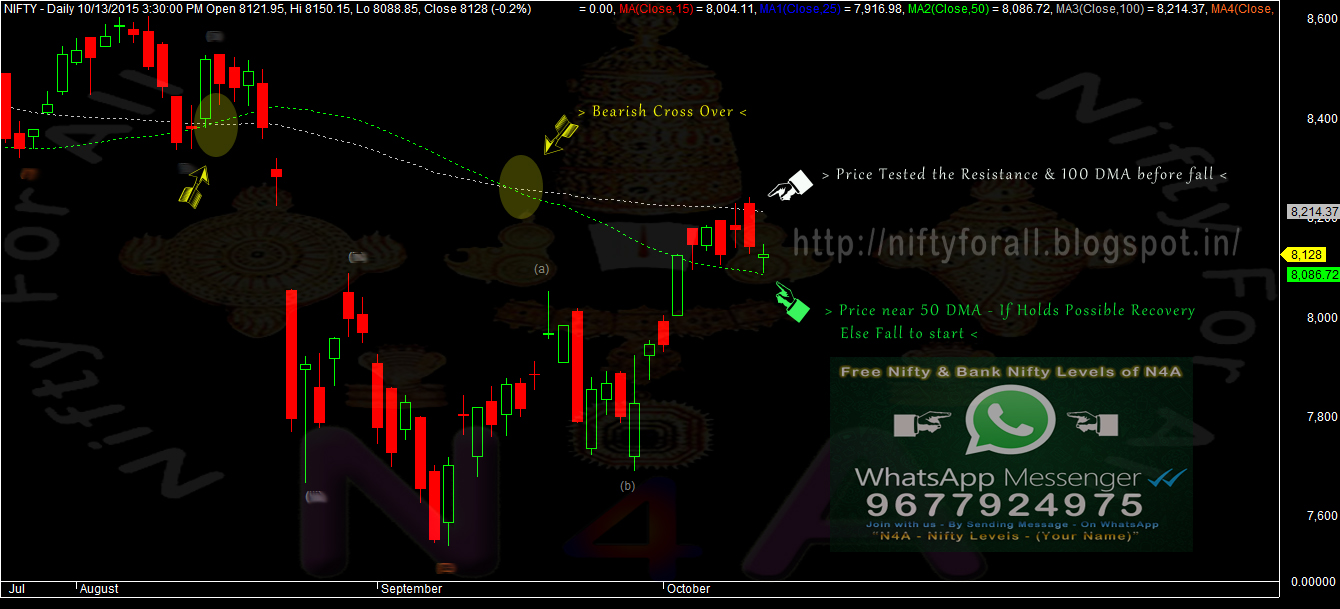
Its a Tussle with 50 & 100 DMA. If 50DMA Holds, Possible recovery, If breaks Must correct.

>>> Bank Nifty Daily Chart <<<

>>> Click the chart to see on full screen <<<

Again BN also having the same tussle with 50 DMA. Struggling to find the direction. Lets wait and See. Cheers!!!

Monday, October 12, 2015

8115 Support. Though, Positive IIP Data - Still Chart Not looking Bullish.

Dear All,

>>> Nifty Hourly Chart <<<

>>> Click the chart to see on full screen <<<

Above chart - as per today's closing - Says some Bearish Out look. But Today's IIP and CPI (after market hours) may give a gap up Opening tomorrow. Many might have lost their patience - due to heavy volatile upmove for last 6 trading session and started asking about the Opposite trade also. Never mind, We go as per chart. No Judgement.
So what's the Problem ??? - Price getting extended so far, not able to give a break out till now. Indicator and counts are giving a Negative Outlook only. So far we have witnessed a lot of Volatile - still more to come. But we need a constant Proof for a change in strategy, till then remain with what it says. That's the Rule. But don't forget - Patience Pays at any Cost.
Since last 5 trading days, Price moving inside a channel (like an expanding triangle) as shown on above chart - gives a lot of possibilities. Now the Price must break and close above the Upper end of the Channel - 8260 - for a positive upmove. Lets see how the Price moves tomorrow.

>>> Bank Nifty Hourly <<<

>>> Click the chart to see on full screen <<<

RSI not moving with the Price. Even after 50 BPS rate cut from RBI - there is no positive break out on chart. So what's cooking. Only the coming result season has the answer. Many Banks are on Headlines like Bank of Baroda on 6000 Cr Money Transfer Case, IDBI on Kingfisher's 900 Crore Loan case. It looks like NPA are setting up a stage and might impact both the top line and bottom line soon for every banks. So we need some constant break out on chart - which must say to you that "ITS TIME TO BUY". I think its not happening so far. As usual - lets wait for tomorrow's move to decide. Cheers!!!

Saturday, October 10, 2015

Weekly Review - 12.10.2015

Dear All,

>>> Nifty Daily Chart <<<

>>> Click the chart to see on full screen <<<

Price almost filled the gap left above. As we mentioned last week - Price moving as A-B-C wave. Next week, any cross above 8230 may trigger a fresh rally and short covering. Provided, if filed to cross may trigger a fresh sell off. Next Week is highly crucial for both bulls and Bears.

>>> Nifty Hourly Chart <<<

>>> Click the chart to see on full screen <<<

Wave A = Wave C. Wave C almost rallied 540 Points. Next week if the upper channel is crossed, Expect a Fresh Rally. Else Bears may re-enter.

>>> Bank Nifty Daily Chart <<<

>>> Click the chart to see on full screen <<<

After 50 BPS rate cut from RBI - there is no major movement seen on bank nifty so far. Since all the banks are struggling with their NPA and Cost of funds, might have a negative effect on their balance sheet. Most of the PSU banks are still struggling at their lower price range.
As per above chart - technically price almost filled the gap left as shown on chart, now struggling to move ahead. 50 and 100 DMA - Price should cross above for a healthy rally.

>>> Bank Nifty Hourly Chart <<<

>>> Click the chart to see on full screen <<<

Hope above chart is easy to understand by its move and pattern. If the Price unable to cross above the channel top - expect to test the support at the bottom of the channel.


>>> Siemens - As Posted on Last Weekly Review <<<

>>> Click the chart to see on full screen <<<

Have posted on Last Weekly Review - about SIEMENS - Possible correction on card. See what happened.

>>> SIEMENS - Happened <<<

>>> Click the chart to see on full screen <<<

We are still holding our short and expecting a correction soon.


>>> LICHSGFIN <<<

>>> Click the chart to see on full screen <<<

Explained on above chart - how the price traveled so far - as ABC Upmove. So expect some correction if the price breaks the support. We have short position in the above mentioned stock. Lets See. Cheers!!!

Thursday, October 08, 2015

Trap or a Crap...!!!

Dear All,

>>> Nifty Hourly Chart <<<

>>> Click the chart to see on full screen <<<

Neither a Profit booking nor a Trend reversal shall be confirmed only on further movement. Though indicators on -ve div, price need to confirm the same. Lets wait for it.

>>> Bank Nifty Hourly Chart <<<

>>> Click the chart to see on full screen <<<

Price filled the gap. Like nifty - BN too had a -ve div. Though we need to wait for more confirmation on either side movement. Lets Wait and See. Cheers!!!

Wednesday, October 07, 2015

Volatile Market moving towards 8208

Dear All,

>>> Nifty Hourly Chart <<<

>>> Click the chart to see on full screen <<<

Moving towards the resistance with lot of volatile. Lets wait and Watch.

Tuesday, October 06, 2015

Resistance @ 8208-8225

Dear All,

>>> Nifty Hourly Chart <<<

>>> Click the chart to see on full screen <<<

Its a 515 Points rally as A-B-C. Hence 8208 or 8225 act as a stiff resistance. Lets wait and see.

Monday, October 05, 2015

Next Resistance @ 8208-25

Dear All,

>>> Nifty Hourly Chart <<<

>>> Click the chart to see on full screen <<<

So lets wait for the given resistance to decide. Cheers!!!

Saturday, October 03, 2015

Weekly Review - 05.10.2015

Dear All,

>>> Nifty Hourly Chart <<<

>>> Click the chart to see on full screen <<<

Above Hourly Chart - Explained with Time and Price Zone...
As per ... Key Resistance 8008-21, Cross above may trigger a Rally and Short Covering till 8208.
Unable to cross may trigger a Sell Off and Fall till Previous low 7690 or even below.

>>> Bank Nifty Hourly Chart <<<

>>> Click the chart to see on full screen <<<

Again Bank Nifty Hourly Chart - Explained with Time and Prize Zone.
Key Resistance 17430-460 - If crosses then - Rally and Short Covering till 17825.
Else - Sell off till 16550 or even below.

>>> SIEMENS - As Posted on 28th Sep, 2015 <<<

>>> Click the chart to see on full screen <<<

Posted the above chart on 28th Sep, 2015 - for a possible correction. See what happened.

>>> SIEMENS - Happened <<<

>>> Click the chart to see on full screen <<<

Stock made a low of 1250 and bounced till 1355. As per above chart, I assume that the rally might have completed as 1-5 for wave C. Hence Price may face a resistance at 1355, If so expect a correction next week. We are holding our short still.

>>> ARVIND - Posted on 22nd Sep, 2015 <<<

>>> Click the chart to see on full screen <<<

Posted on 22nd Sep, 2015 - Stock may face some correction. See what happened

>>> ARVIND - Happened <<<

>>> Click the chart to see on full screen <<<

As mentioned earlier - We are still on Short. As per above chart - If price breaks the Channel support - Expect a free fall again. Cheers!!!

>>> PERFORMANCE for the month end of 30th Sep, 2015 <<<

>>> Click the chart to see on full screen <<<

Kindly send Your request on our email id niftyforall@yahoo.com for details of our service.

Wednesday, September 30, 2015

Next Resistance @ 7984 & 8022

Dear All,

>>> Nifty Hourly Chart <<<

>>> Click the chart to see on full screen <<<
Crossed above 7930 and next resistance @ 7984 and 8022. Positive Data Like Core Sectors and Global Markets Rally may help index to open positive once again tomorrow. Lets wait and see. Cheers!!!

Tuesday, September 29, 2015

More Volatile Ahead - Caution

Dear All,

>>> Nifty Hourly Chart <<<

>>> Click the chart to see on full screen <<<

Yes we have covered the shorts today with Nifty 500 Points and Bank Nifty 800 Points.
After 50 BPS rate Cut form RBI - Price spiked and test above 7910 - Shows more volatile ahead.
As per above chart - If I am not wrong - Price may test the lower end of the channel and may try to bounce back to fill the gap left above, In such a case - Expect a complete volatile trading in coming days.

>>> YesBank - As Posted on 22nd Sep, 2015 <<<

>>> Click the chart to see on full screen <<<

Wrote Last time on Yes Bank - may test 700 any time soon. See what happened.

>>> YESBANK - Happened <<<

>>> Click the chart to see on full screen <<<

As Expected - Price almost touched 702.75 and gave us a good Profit of Rs.18250/-

>>> M&M <<<

>>> Click the chart to see on full screen <<<

Yes We have shorted M&M at 1273 and Price touched a low of 1236 - Expecting a more fall till 1190 - Lets Wait and See. Cheers!!!