Pages

Thursday, August 18, 2016

8685 > Above Upmove

Dear All,

>>> Nifty Hourly Chart <<<

>>> Click the chart to see on full screen <<<

Price if crosses 8685 - may possibly test 8720 and 8750 soon.

>>> Bank Nifty - Posted on 16th Aug, 2016 <<<

>>> Click the chart to see on full screen <<<

Have mentioned 19150 as an important resistance. See what happened today.

>>> Bank Nifty Hourly Chart - Happened <<<

>>> Click the chart to see on full screen <<<

We have exited our short above 19150 and price test 19367-70 Level.

>>> Asian Paints - As Posted on 10th Aug, 2016 <<<

>>> Click the chart to see on full screen <<<

Have wrote on 10th Aug, 2016, Asian Paint may correct. See what happened.

>>> Asian Paints - Happened - More Correction Possible <<<

>>> Click the chart to see on full screen <<<

RSI and MA's - almost confirmed the Correction. Lets Wait and See. Cheers!!!

Wednesday, August 17, 2016

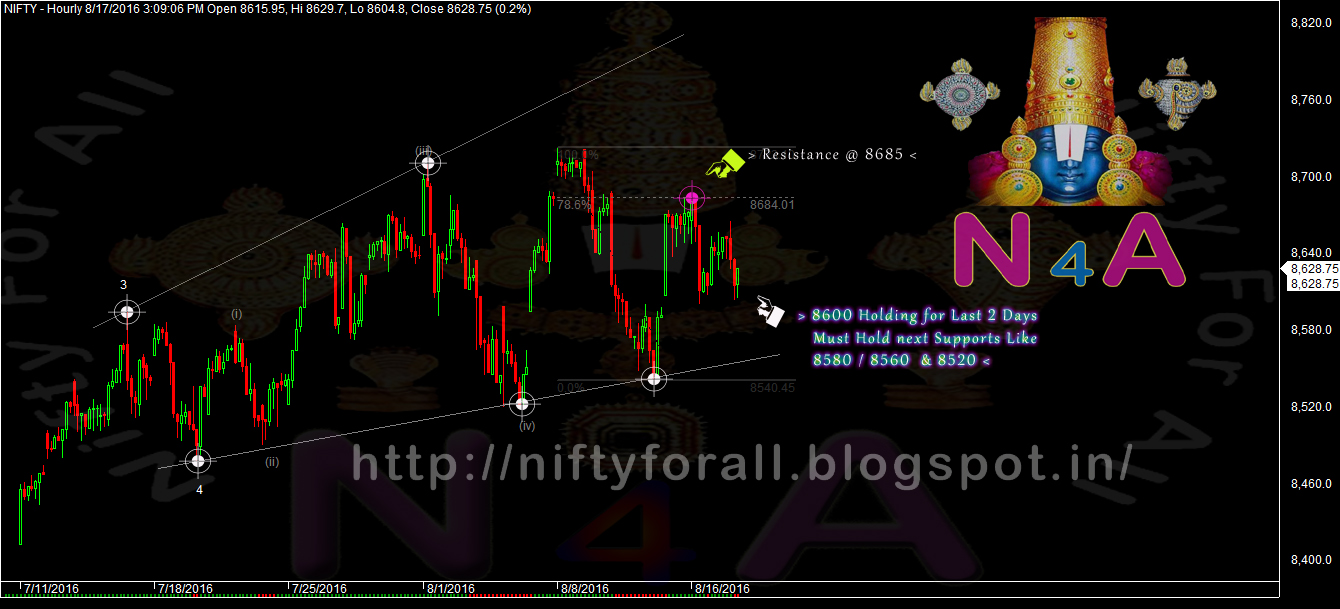
Support @ 8600 - 8580 - 8560 & 8520

Dear All,

>>> Nifty Hourly Chart <<<

>>> Click the chart to see on full screen <<<

8600 Holding for last two days. Lets wait and watch for next support 8580 / 8560 & 8520. Else 8685 or 8720 should cross for Strength.

Tuesday, August 16, 2016

Resistance @ 8685. Support @ 8560 & 8540

Dear All,

>>> Nifty Hourly Chart <<<

>>> click the chart to see on full screen <<<

Price Resisted @ 8685 and Should watch Support @ 8560 & 8540 Levels.

>>> Bank Nifty Hourly Chart <<<

>>> click the chart to see on full screen <<<

Price above the channel - Must break above 19150 for a meaningful rally. Cheers!!!

Sunday, August 14, 2016

Weekly Review 16th August, 2016

Dear All,


Inflation and industrial production data:- The market will react to July inflation data as well as industrial output data for June, which came after market hours on Friday. Consumer price inflation rose at the faster-than-expected pace to 6.07 per cent in July, up from 5.77 per cent in June, government data showed on Friday. India's industrial output rose 2.1 per cent in June from a year earlier, driven by consumer durables and electricity production.

Minutes of July US Fed policy meet:- Market participants across the globe will keep a close eye on the minutes of the July policy meet of the US Fed, which will be released on August 17, Wednesday.

The minutes of the Fed's July policy meeting may come under scrutiny given that the central bank has only one opportunity left at its meeting next meeting to raise rates before the November presidential election, said a media report.

In July, the US Fed left key benchmark policy rates unchanged at 0.2 per cent while saying that the 'near-term risks' to the economy have diminished.

WPI Inflation:- India's wholesale price index-based (WPI-based) inflation, which accelerated in June from the previous month, will be in focus. The index touched a 20-month high last month as prices of fruits, vegetables and cereals continued to rise.

Data released by the Department of Industrial Policy and Promotion showed that WPI-based inflation quickened to 1.62 per cent in June from 0.79 per cent recorded in the month of May.


>>> Nifty Weekly Chart <<<

>>> Click the chart to see on full screen <<<

Weekly Chart on Nifty shows a Second time Hanging Man on the top of the channel. Bulls having lot of strength to move up the price, as RSI also gave a Break out from trend line. Lot of positive sentiments and FII's continue to remain on the BUY Side. Only a Strong Sell off or a Big Bad News can Revert the Market, Until then Bulls may remain with its upper hand.

>>> Nifty Hourly Chart <<<

>>> Click the chart to see on full screen <<<

Price of Nifty Hourly Chart - Inside a Expanding like triangle. If 8685 Crosses, may test 8750.

>>> Bank Nifty Weekly Chart <<<

>>> Click the chart to see on full screen <<<

Last two weeks its a Clear Hanging man on the top and continuously last 5 weeks unable to cross above 19150.

>>> Bank Nifty Hourly Chart <<<

>>> Click the chart to see on full screen <<<

Unlike Weekly Chart of BN - Hourly give a different picture. Price if breaks above the channel as shown on chart - Expect some short covering and rally too.

>>> SBIN - Posted Last Weekly Review <<<

>>> Click the chart to see on full screen <<<

Last Weekly Review - Wrote 235.50 as a Key Resistance - Price crossed and We exited our Shorts with Loss. So what's Next ?

>>> SBIN - Follow Up <<<

>>> Click the chart to see on full screen <<<

After results declared on friday - Price continue to raise in the wedge as shown above. Price needs to test 254 resistance or top of the channel. If crosses above the channel - Price may give a fresh rally also. We may or may not enter either short or long again as per movement.

>>> CENTURYTEX - Posted on 09th Aug, 2016 <<<

>>> Click the chart to see on full screen <<<

Wrote - CenturyTex may have a correction soon.

>>> CENTURYTEX - Booked Profit Rs.44000/- <<<

>>> Click the chart to see on full screen <<<

Booked Profit Rs.44000/-

>>> ASIANPAINT - Hold Shorts <<<

>>> Click the chart to see on full screen <<<

Holding the short.

>>> Performance till 12th Aug, 2016 <<<

>>> Click the chart to see on full screen <<<

Above performance is not a Promise or guarantee for the given Profits or Loss. Performance given based on 1 lot at a time and clients Profit differ as per the margin availability and Number of Lots taken by them. We may or may not re-enter the Calls given here hit Stop Loss, as per market movement. The charts given above are just for educational purpose only and we don't recommend any Entry / Buy or Exit / Sell. Reader must taken their own decision or consult their qualified Analyst before making any decision.

Thursday, August 11, 2016

Support @ 8540 & 8520

Dear All,

>>> Nifty Daily Chart <<<

>>> Click the chart to see on full screen <<<

Price and RSI broken their Key Support Line on Daily Chart. Stay caution.

>>> Nifty Hourly Chart <<<

>>> Click the chart to see on full screen <<<

Today - Price took support @ 8540 - Must hold 8520 & 8476 for Upmove. lets See. Cheers!!!

Wednesday, August 10, 2016

Support @ 8560 & 8520 Must Hold for Upmove

Dear All,

>>> Nifty Hourly Chart <<<

>>> Click the chart to see on full screen <<<

Next Support @ 8560 & 8520 must hold to help the bulls.

>>> CENTURYTEX - Posted Yesterday <<<

>>> Click the chart to see on full screen <<<

Posted Yesterday - Wrote about a Possible correction. See what happened.

>>> CENTURYTEX - Profit Booked Rs.44000/- <<<

>>> Click the chart to see on full screen <<<

Booked Profit today Rs.44000/-

>>> AMBUJA - Posted on Weekly Review <<<

>>> Click the chart to see on full screen <<<

Wrote on weekly Review also - Ambuja may correct any time. See what happened.

>>> AMBUJA - Follow Up - More Correction Possible <<<

>>> Click the chart to see on full screen <<<

Holding for More correction.

>>> ASIAN PAINT - Daily Chart <<<

>>> Click the chart to see on full screen <<<

Asian Paint - May correct - If price breaks the given support line on chart. Lets Wait and See. Cheers!!!

Tuesday, August 09, 2016

Next Resistance @ 8760-80. Support @ 8560 & 8520

Dear All,

>>> Nifty Hourly Chart <<<

>>> Click the chart to see on full screen <<<

Price Need to break on either side for confirmation. Resistance @ 8760-80 or Support @ 8560-20

>>> CENTURYTEX - Daily Chart <<<

>>> Click the chart to see on full screen <<<

Price unable to cross above the wedge channel for 3rd time. If the Support channel breaks - Expect a good correction. Cheers!!!

Sunday, August 07, 2016

Weekly Review 08th August, 2016

Dear All,


Nifty was sluggish through out the week, managed to bounce back on friday supported by Liquidity gush in the system. The PMI data points towards an acceleration in the economy. The macro indicator suggests whopping 5.2 per cent expansion in July as against 2.8 per cent in May and 2.8 per cent in the corresponding previous year. Markets too are continuously discounting the encouraging macroeconomic numbers. July automobiles growth numbers surprised the Street.

Key events of the week: Foundation for the historic path-breaking tax reform has been laid down last week. Now the superstructure will be built over a period of time through the state approvals etc. GST will truly lead India to accelerated corruption free inclusive growth for the masses in the country.

Far reaching amendments were cleared by the law makers for speedy and hassle free debt recovery in a time bound manner further enhancing the Bankruptcy Code for making India Bad Debt free economy.

There was covering of short positions with the clearance of the GST Bill in the Rajya Sabha and the quantitative easing by the Bank of England also aided the rally. Most of the gains were led by the Indian consumption sectors such as auto and financials among others.

The Bank of England on Thursday reduced its benchmark interest rate to a record low of 0.25% from 0.5%, the lowest in its 322-year history.

The India Meteorological Department on Thursday said that monsoon rains during the week from 28 July to 3 August 2016 was above long period average (LPA) by 6%.

Further, reports suggest that the government is likely to table the GST Bill in the parliament on Monday, August 8. The target for the rollout of the GST Bill is scheduled for April 01, 2017.

>>> Open Interest Index Futures <<<

The week gone by marked the beginning of the August Expiry. Since 29th July, FII and PRO combined have bought 1711650 shares in Index Futures. This indicates that big players are building long positions in market. Entire week saw a continuous below average buying in Index Futures.


>>> Open Interest Index Options <<<

The week gone by marked the beginning of the August Expiry. Since 29th July, FII and PRO combined have sold 107913975 shares in Index Options. Market witnessed profit booking for the entire week except on Friday, where the bulls took over the control again with an above average buying of 6692925 shares in index options.


The week gone by marked the beginning of the August Expiry. Since 29th July, FII continued its buying spree in the cash segment with a buy totaling worth Rs. 2821 cr. DII, on the other hand stood opposite with a net sell worth RS. 1361 cr in the same period. Combined, shares worth Rs. 1460 cr were bought for the week.


The combine FII and Pro have seen a continued increase in long position in Index future and an increase of Short position in index options. In the cash segment FII and DII combined are net buyers of Rs. 1460 Cr since 29th July 2016

Let's See Technical.

>>> Nifty Weekly Chart <<<

>>> Click the chart to see on full screen <<<

Price closed above previous high 8654 and RSI gave a Break out. Key Resistance 8710-20 must give a confirmation to bulls for a Go ahead Rally.

>>> Nifty Daily Chart <<<

>>> Click the chart to see on full screen <<<

RSI took support from the trend line, must cross above trend line for a break out confirmation. Price must cross and close above 8720 for a healthy rally.

>>> Nifty Hourly Chart <<<

>>> Click the chart to see on full screen <<<

RSI continue to make a LH while Price making a HH. Next week if RSI gives a break out - Expect a good short covering and rally.

>>> Bank Nifty Daily Chart <<<

>>> Click the chart to see on full screen <<<

Price making a throw back rally - after a break down with RSI.

>>> SBIN - Follow Up <<<

>>> Click the chart to see on full screen <<<

Price making an upmove - may face resistance @ 235.50.

>>> JUSTDIAL - Posted Last Weekly Review <<<

>>> Click the chart to see on full screen <<<

Last Weekly Review Updated Just Dial as a Break Out - See what happened.

>>> JUSTDIAL - Break Out Failed & SL Hit <<<

>>> Click the chart to see on full screen <<<

Break Out Failed. SL hit and Exited with Loss.

>>> AMBUJA - Posted on 03rd Aug, 2016 <<<

>>> Click the chart to see on full screen <<<

Wrote on 03rd Aug, 2016, Ambuja completed ABC wave and may have a possible correction.

>>> AMBUJA - Follow Up <<<

>>> Click the chart to see on full screen <<<

Cross and close above the channel may reverse the trend and current count and analysis get negated.

>>> Performance till 05th Aug, 2016 <<<

>>> Click the chart to see on full screen <<<
Above performance is not a Promise or guarantee for the given Profits or Loss. Performance given based on 1 lot at a time and clients Profit differ as per the margin availability and Number of Lots taken by them. We may or may not re-enter the Calls given here hit Stop Loss, as per market movement. The charts given above are just for educational purpose only and we don't recommend any Entry / Buy or Exit / Sell. Reader must taken their own decision or consult their qualified Analyst before making any decision.


Wednesday, August 03, 2016

Support @ 8530 & 8480

Dear All,

>>> Click the image to see on full screen <<<

Above image shows - how the GST Bill impacted the Other Nations during the year its introduced. So also to us, hope every one can understand what may happen for us, But as per news it looks like GST will be Introduced from FY17.

>>> Nifty Hourly Chart - Posted Yeserday <<<

>>> Click the chart to see on full screen <<<

Wrote Yesterday - Price resisted @ 8710 and may see a possible correction - if not crossed above it.

>>> Nifty Daily Chart - Happened <<<

>>> Click the chart to see on full screen <<<

Price made a first sign of Bearishness, and if RSI confirms the same, More correction possible.

>>> Bank Nifty - Daily - Posted on 01st August, 2016 <<<

>>> Click the chart to see on full screen <<<

Wrote many times - Bank Nifty unable to cross our resistance and broken down for a correction. See what happened.


>>> Bank Nifty - Happened <<<

>>> Click the chart to see on full screen <<<

We are short in Bank Nifty above 19000 and still holding for a Good Correction

>>> AMBUJA - Daily Chart <<<

>>> Click the chart to see on full screen <<<

We hope that the Current rally on Ambuja has been completed as ABC wave and looks like it may correct. We have shorted Ambuja and holding it for a good correction. Cheers!!!